Our system will evaluate the answer based on this AI-generated description.
The image displays a bar graph demonstrating the age distribution of Iceland's population from 1990 to 2020 in five-year increments, with five age ranges represented by distinct colors. In 1990, ages 0-14 accounted for approximately 30%, ages 15-24 constituted about 15-20%, ages 25-54 comprised around 45%, ages 55-64 made up roughly 8%, and ages 65 and over occupied about 10%. In 2000, ages 0-14 decreased to about 25%, ages 15-24 remained around 15-20%, ages 25-54 increased to almost 50%, ages 55-64 stayed at 8%, and ages 65 and over rose to nearly 12%. In 2010, ages 0-14 further dropped to approximately 20%, ages 15-24 stayed around 15-20%, ages 25-54 decreased to about 45%, ages 55-64 increased to nearly 10%, and ages 65 and over climbed to almost 15%. Lastly, in 2020, ages 0-14 stayed at 20%, ages 15-24 remained around 15-20%, ages 25-54 decreased to roughly 40%, ages 55-64 increased to around 12%, and ages 65 and over rose to roughly 20%.
Given the complexity of the image, the above description may not be entirely accurate.
Skyrocket your IELTS band score by 1-2 points in under a month with our premium plan!
Note: Both the topic and the answer were created by one of our users.
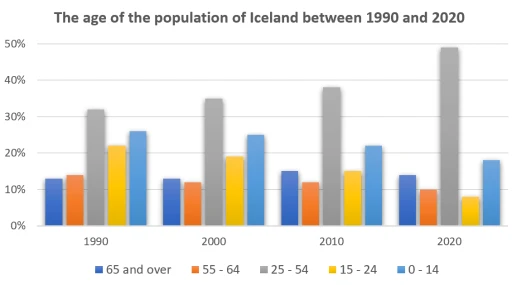
The bar chart illustrates the percentage distribution of Iceland’s population across five age groups (0–14, 15–24, 25–54, 55–64, and 65 and over) in 1990, 2000, 2010, and 2020. Overall, there was a noticeable decline in the younger age groups, significant growth in the older age groups, and the working-age population remained the largest category throughout the period.
The 25–54 age group consistently dominated the population structure, showing stability over the years and eventually increasing further by 2020. In contrast, the younger age groups, including 0–14 and 15–24, experienced a continuous decline, reflecting a decrease in the proportion of younger people within the population.
On the other hand, the older age groups, particularly those aged 55–64 and 65 and over, showed steady growth over the period, highlighting an aging trend in the population. These changes indicate a shift in demographics, with a rising proportion of older individuals and a decreasing share of younger people.
Word Count: 153