🔥 Today Only: Save 30% on Premium — Offer Ends Soon! - Upgrade Now!
Map

Band 6+: The graph shows annual cinema admissions by age in the UK. Summarise the information by selecting and reporting the main features, and make comparisons where relevant.

Image for topic: The graph shows annual cinema admissions by age in the UK. Summarise the information by selecting and reporting the main features, and make comparisons where relevant.
Our system will evaluate the answer based on this AI-generated description.
The image presents two maps detailing home language distributions in Cape Town for 2001 and 2011, divided into four language categories: Afrikaans, English, Xhosa, and regions with no dominant language. In 2001, Afrikaans predominates in the Cape Flats Region, with scattered presence elsewhere. English is primarily seen in the northwestern area and around the City Bowl, with limited spots in the northeastern fringes. Xhosa is strongly centered in the southeastern suburbs and isolated pockets in the city periphery. Regions with no dominant language are sparse, mostly occurring adjacent to Xhosa and English regions. By 2011, Afrikaans remains widespread in similar areas but with increased presence in the southwest. English regions expand slightly towards the east of the original spots and northwest edges, while Xhosa areas are condensed but retain concentration in southeastern Cape Town and increase in central areas. Regions with no language dominance marginally expand, appearing more prominently in central and southern locations.
Given the complexity of the image, the above description may not be entirely accurate.
Note: Both the topic and the answer were created by one of our users.

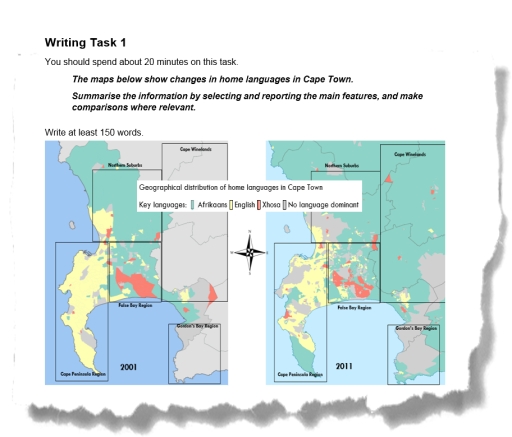
The diagrams illustrate changes in native languages in Cape Town over the course of 10 years.

Overall, over time, people in Cape Town started speaking more Afrikaans. This resulted in a dramatic rise in the Afrikaans language, while the frequency of people speaking English dropped significantly. Similarly, Xhosa was spoken less in 2011 compared to 2001.

Looking at each region, it is evident that the most substantial change was seen in Cape Winelands, where there was no majority language spoken in 2001. However, by 2011, Afrikaans became the dominant language. In contrast, inhabitants of the Cape Peninsula Region mostly spoke English in 2001, but, over the 10 years, no language was dominant in some parts of the Peninsula, while in other parts, languages such as Xhosa and Afrikaans started spreading. Moving on to the False Bay Region, the area was diverse in terms of language, with English, Xhosa, and Afrikaans all being spoken. Although, throughout the ten years, languages disappeared as no particular language was dominant in many places within the Bay region.

Word Count: 173

Other Topics:

the maps show changes in İstanbul in 2000 and today.

The maps illustrate renovations in İstanbul City Library between 2000 and today. Overall, the changes can be divided into 3 categories which are replacements, non-changements and additions. Moreover, the library has developed cafe opportunities over years. In 2000, fiction genre books covered most of the place in the city library. By the present day, art, […]

The maps provide the information about the previous situation of the central library 20 years ago and how it looks now in the present day.

The maps illustrate how the Central Library has been modernized. Overall, it is clear that the entrance hall has been reorganized, while several rooms have undergone significant changes in their functions. Looking at the maps, we can see that tables and chairs were removed from the entrance hall. In the south-east part of the library, […]

The maps show the layout of a beachfront in Australia in 1950 and its current design.

The two maps illustrate the transformations that have taken place in an Australian beachfront area from 1950 to the present day. Overall, the site has undergone significant development, shifting from a simple recreational spot to a more modernized coastal area. While some original structures like the lighthouse and pavilion remain, the transportation infrastructure has been […]

The maps show the layout of a beachfront in Australia in 1950 and its current design.

The two maps illustrate the difference of the beachfront’s layout in Australia from 1950 to today. Overall, the beach is located to the south of the map surrounded by two pools and a lighthouse. On the northern side, there is a road adjacent to the car park, and leads west toward the city. Since 1950, […]

The charts show how an office looks like at present and its future development plan.

The two maps show the current office and how it is going to transform to a new working area for future advancement. Overall, entrance will be moved to the bottom center of the building and kitchen areas will be demolished for giving more space for the office rooms. A couple of facilities will be constructed […]

The charts show how an office looks like at present and its future development plan.

The chart provide information about how an office looks like at present and its future development plan. Overall, some rooms will be removed to make other rooms bigger, and it replace some rooms by other rooms. Right now, building has 4 small offices, and 2 grass areas. In addition, it has a kitchen, canteen, and […]

See All
We have detected unusual activity on your device.
Please verify your identity to continue.
Note: This verification step won't sign you in. If you have a premium account, please log in to access the service as usual.
Google/Gmail Verification
Or verify using Email/Code
We've sent a verification code to:
youremail@gmail.com (Not your email?)
Enter it below to complete the verification process.
Ensure your email address is correct, your inbox is not full, and you check your spam folder. If no email arrives, consider using an alternative email.
You will need a Premium plan to perform your action!
Note: If you already have a premium account, please log in to access our services as usual.

Plans & Pricing

Our mission is to make quality education accessible for everyone.
However, to keep our hardworking team running and this service alive, we genuinely need your support!
By opting for a premium plan, not only do you sustain us in achieving the mission, but you also unlock advanced features to enrich your learning experience.

Free

For learners who aren't pressed for time

What's included on Free
100+ Cambridge IELTS Tests
Instant IELTS Writing Task 1 & 2 Evaluation (2 times/month)
Instant IELTS Speaking Part 1, 2, & 3 Evaluation (5 times/month)
Instant IELTS Writing Task 1 & 2 Essay Generator (2 times/month)
500+ Dictation & Shadowing Exercises
100+ Pronunciation Exercises
Flashcards
Other Advanced Tools

Premium

For those serious about advancing their English proficiency, and for IELTS candidates aspiring to boost their band score by 1-2 points (especially in writing & speaking) in just 30 days or less

What's included on Premium
Save Your IELTS Test Progress
Unlock All Courses & IELTS Tests
Unlimited AI Conversations
Unlimited AI Writing Enhancement Exercises
Unlimited IELTS Writing Task 1 & 2 Evaluation
Unlimited IELTS Speaking Part 1, 2, & 3 Evaluation
Checked Answers Will Not Be Published
Unlimited IELTS Writing Task 1 & 2 Essay Generator
Unlimited IELTS Speaking Part 1, 2, & 3 Sample Generator
Unlimited Usage Of Advanced Tools
Priority Support within 24h (12-month plan only)

Due to the nature of our service and the provided free trials, payments are non-refundable.
Nếu bạn là người Việt Nam và không có hoặc không muốn trả bằng credit/debit cards, bạn có thể thanh toán bằng phương thức chuyển khoản:


Chọn gói:
419,000₫ 277,000 ₫ cho gói 1 tháng (chỉ 9,233₫/ngày)
1,239,000₫ 597,000 ₫ cho gói 3 tháng (chỉ 6,633₫/ngày)
2,469,000₫ 1,027,000 ₫ cho gói 6 tháng (chỉ 5,706₫/ngày)
4,929,000₫ 1,417,000 ₫ cho gói 12 tháng (chỉ 3,936₫/ngày)


Sau khi chuyển khoản, vui lòng đợi trình duyệt tự động điều hướng bạn trở lại Engnovate và bạn sẽ ngay lập tức nhận được mã kích hoạt tài khoản premium.
Nếu có lỗi xảy ra, bạn có thể liên hệ với team thông qua một trong các phương thức: email đến helloengnovate@gmail.com hoặc nhắn tin qua facebook.com/engnovate.
Vì toàn bộ công cụ trên website đều có thể sử dụng thử miễn phí, Engnovate không hỗ trợ hoàn tiền.