🔥 Today Only: Save 30% on Premium — Offer Ends Soon! - Upgrade Now!
Line Graph

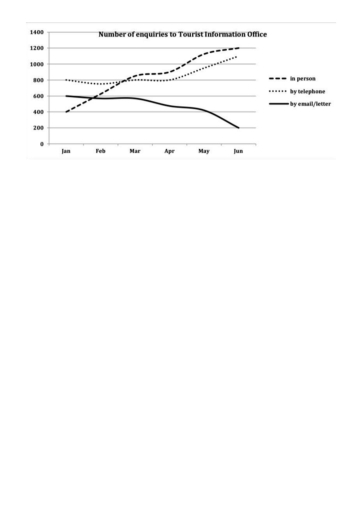
Band 6+: The graph shows the number of enquiries to the tourist information office made by telephone, letter/email, and in person from January 2001 to June 2001. Summarise the information by selecting and reporting the main features, and make comparisons where relevant.

Image for topic: The graph shows the number of enquiries to the tourist information office made by telephone, letter/email, and in person from January 2001 to June 2001. Summarise the information by selecting and reporting the main features, and make comparisons where relevant.
Our system will evaluate the answer based on this AI-generated description.
The image features a line graph titled "Number of enquiries to Tourist Information Office" with the vertical y-axis scaled from 0 to 1400 in increments of 200, and the horizontal x-axis displaying six months: Jan, Feb, Mar, Apr, May, and Jun. A legend identifies three categories: "in person" (dashed line), "by telephone" (dotted line), and "by email/letter" (solid line). For "in person", values across the months are: Jan at 400, Feb at approximately 600, Mar at approximately 860, Apr at approximately 900, May at approximately 1120, and Jun at 1200. For "by telephone", values are: Jan at 800, Feb at approximately 750, Mar at 800, Apr at 800, May at approximately 950, and Jun at approximately 1100. For "by email/letter", values are: Jan at 600, Feb at approximately 570, Mar at approximately 570, Apr at approximately 470, May at approximately 420, and Jun at 200.
Given the complexity of the image, the above description may not be entirely accurate.
Note: Both the topic and the answer were created by one of our users.

The graph shows the enquiries to a tourists information office by email / letter, by telephone, and in persons in the first six months of the year 2001.

Overall, the number of inquiries that made in person increased throughout the period. In contrast the enquiries made by emails and letters decreased over time.

In January the number of inquiries received by the tourist information office by telephone were the highest, recording 800 calls, after that the number was stable until April when it increased sharply to 1100 in June.

Prople who contacted the office directly recorded the lowest number in January at 400 people, then the number increased significantly, reaching 850 in March, then stabled for a short period to increase agian in April until the end of the period which was at the top, recording 1200 visits.

In contrast inquiries by emails and letters decreased throughout the period. Although the number was stable in the first three months, recording 600 messages, it fallen down to 400 in May, and declined to 300 in June.

Word Count: 175

Answers On The Same Topic:

The graph shows the number of enquiries to the tourist information office made by telephone, letter/email, and in person from January 2001 to June 2001. Summarise the information by selecting and reporting the main features, and make comparisons where relevant.

the paraghraph elaborate the count of enquires to tourist information office by different communication ways from january until june in 2001. At the beginning the data tended constant but over time the data revealed some significant change with the most highest number was reached by in person metode and the lowest was obtained by writing […]

See All

Other Topics:

Using the visual data, write a Performance Quality Report (PQR) on students' progress after using Perfamica. Write at least 150 words.

The graph provide the information about the performance quality report (PQR) by using visual data from the month of september to december. Overall the average grade and goal achievement group are increase in a numbers, while peer feedback quality is flustrated. Average grade is increase with approximately 2 to 3 percent to on the stage […]

the graph below shows the percentages of young population in united kingdom from 1990 to 2001

The line graph gives information about the proportion of young population in the UK between 1990 and 2001. Overall, the number of 10-14 year old children became the biggest and overtook all other three age groups. Meanwhile, the percentage of three other groups decreased. The number of 15-19 aged teenagers witnessed a sharp decline from […]

the graph below shows the percentages of young population in united kingdom from 1990 to 2001

The line graph gives infromation about the proportion of young population in the UK between 1990 and 2001. Overall, the number of 10-14 years old childrens became the biggest and overtook all other three age groups. Meanwhile , the percentage of three other group decreased. The number of 15-19 aged teenagers witnessed a sharp decline […]

The line graph below shows the number of visitors to a museum between 2005 and 2015.

The line graph illustrates the changes in number of museum visitors from 2005 to 2015. The data is measured in thousands. Overall, the visitors rate experienced a significant increase over the given period with the episode of plunge, followed by steady growth with a period of stability for short period of time. In 2005, the […]

The line graph shows annual loans of four types of material from the Riverton library network from 2005 to 2025. Summarise the information by selecting and reporting the main features, and make comparisons where relevant.

The graph represents information yearly loans of four different material from the Riverton library network from 2005 to 2025. Overall, printed fiction lost its initial dominance, whereas e-books finished first. The annual loans of e-books and audiobooks rose steadily. Printed non-fiction lost value and became the smallest figure. In 2009, printed fiction reached a peak […]

See All
We have detected unusual activity on your device.
Please verify your identity to continue.
Note: This verification step won't sign you in. If you have a premium account, please log in to access the service as usual.
Google/Gmail Verification
Or verify using Email/Code
We've sent a verification code to:
youremail@gmail.com (Not your email?)
Enter it below to complete the verification process.
Ensure your email address is correct, your inbox is not full, and you check your spam folder. If no email arrives, consider using an alternative email.
You will need a Premium plan to perform your action!
Note: If you already have a premium account, please log in to access our services as usual.

Plans & Pricing

Our mission is to make quality education accessible for everyone.
However, to keep our hardworking team running and this service alive, we genuinely need your support!
By opting for a premium plan, not only do you sustain us in achieving the mission, but you also unlock advanced features to enrich your learning experience.

Free

For learners who aren't pressed for time

What's included on Free
100+ Cambridge IELTS Tests
Instant IELTS Writing Task 1 & 2 Evaluation (2 times/month)
Instant IELTS Speaking Part 1, 2, & 3 Evaluation (2 times/month)
Instant IELTS Writing Task 1 & 2 Essay Generator (2 times/month)
500+ Dictation & Shadowing Exercises
100+ Pronunciation Exercises
Flashcards
Other Advanced Tools

Premium

For those serious about advancing their English proficiency, and for IELTS candidates aspiring to boost their band score by 1-2 points (especially in writing & speaking) in just 30 days or less

What's included on Premium
Save Your IELTS Test Progress & Analyze Mistakes By Question Type
Save Your Own Flashcard Sets & Use Them On Any Device
Unlock All Courses, IELTS Tests, Section & Part Practice
Unlimited AI Conversations
Unlimited AI Writing Enhancement Exercises
Unlimited IELTS Writing Task 1 & 2 Evaluation
Unlimited IELTS Speaking Part 1, 2, & 3 Evaluation
Checked Answers Will Not Be Published
Unlimited IELTS Writing Task 1 & 2 Essay Generator
Unlimited IELTS Speaking Part 1, 2, & 3 Sample Generator
Unlimited Usage Of Advanced Tools & AI Features
Priority Support within 24h (12-month plan only)

Due to the nature of our service and the provided free trials, payments are non-refundable.