Our system will evaluate the answer based on this AI-generated description.
The image features a line graph detailing the number of total marriages, first marriages, second marriages, and divorces in the UK from 1975 to 2000. For 1975, total marriages stand at 400,000, first marriages at 340,000, second marriages at approximately 60,000, and divorces around 130,000. In 1980, total marriages rise to about 480,000, first marriages to around 400,000, second marriages remain near 60,000, and divorces increase slightly to about 140,000. By 1985, total marriages decrease to approximately 380,000, first marriages drop to around 290,000, second marriages increase to about 80,000, and divorces rise to 160,000. In 1990, total marriages are around 340,000, first marriages at 250,000, second marriages rise again to 90,000, and divorces reduce marginally to 150,000. For 1995, the figures are 280,000 for total marriages, 230,000 for first marriages, nearly 95,000 second marriages, and divorces drop to about 140,000. In the year 2000, total marriages continue to decrease to 260,000, first marriages to 200,000, second marriages slightly decrease to about 90,000, and divorces settle around 140,000.
Given the complexity of the image, the above description may not be entirely accurate.
Skyrocket your IELTS band score by 1-2 points in under a month with our premium plan!
Note: Both the topic and the answer were created by one of our users.
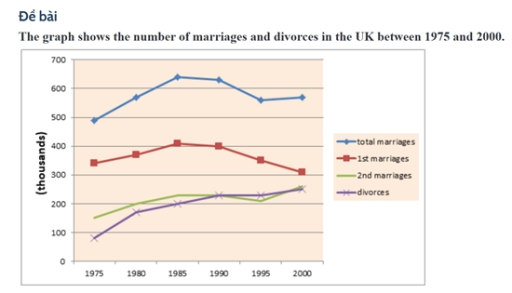
The graph illustrates information about the number of people who had marriages and divorces in the UK, over a twenty-five-year period between 1975 and 2000
Overall, what stands out from the graph is that there was considerable upward trends in the number of divorces and 2nd marriages, except for 1st marriages. Another interesting point is that the number of first marriage was the highest during the period in question.
Looking at the details, as regards to 1st marriage, it had approximately 325,000 marriages in 1975. Until 1990, the marriages started decreasing surprisingly from 400,000 to 300,000.
With respect to divorces, which was the least happening in the UK in 1975, it had about 90,000. However, it started increasing from 1975 to 2000, people started having around 245,000 divorces. 2nd marriages had a similar pattern. It started with a small number of people having 2nd marriages, approximately 250,000 during 1975. Having risen from 1975 to 1995, it still had a small dip before recovering and people having around 245,000 2nd marriages.
Word Count: 170