🔥 Today Only: Save 30% on Premium — Offer Ends Soon! - Upgrade Now!
Line Graph

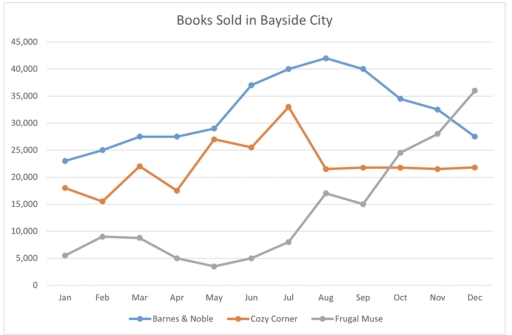
Band 5+: The graph shows the total number of books sold at three bookshops in Bayside City last year. Summarize the information by selecting and reporting the main features, and make comparisons where relevant.

Image for topic: The graph shows the total number of books sold at three bookshops in Bayside City last year. Summarize the information by selecting and reporting the main features, and make comparisons where relevant.
Our system will evaluate the answer based on this AI-generated description.
The image displays a line graph titled "Books Sold in Bayside City" showing monthly data from January to December with three bookstores – Barnes & Noble, Cozy Corner, and Frugal Muse. Barnes & Noble's sales start at approximately 15,000 in January, steadily increase to peak near 40,000 in July, drop slightly in August, then climb to highest at over 40,000 in December. Cozy Corner begins around 22,500, sharply increases to 35,000 in February, zigzags down to 20,000 in April, peaks around 32,500 in June, falls to 15,000 in September, and ends near 25,000 in December. Frugal Muse has lowest sales, starting around 5,000 in January, with a minor increase to 7,500 in February, a sharp rise to 15,000 in June, remaining flat until a decrease to 10,000 in November, and a small rise to finish near 12,500 in December. The exact numbers for each point on the graph are not provided.
Given the complexity of the image, the above description may not be entirely accurate.
Note: Both the topic and the answer were created by one of our users.

The provided graph illustrastes the total books sold from three bookstores; Barnes & Noble, Cozy Corner and Frugal Muse in Bayside City. The horizontal axis represents the months, while the vertical axis presents the number of books respectivily.

Cozy Corner initated at below 20,000 books at the start of the year, whereas barnes & Noble started at about 24,000 books. Barnes & Noble gradually grew to 40,000 books at its peak, yet considerably dropped to 28,000 books. Meanwhile, Cozy Corner shows the fluctuation throughout from the Febuary to july. It rose to the top at about 34,000 books in july before noticebly dropped to above 20,000 and became stable at the end of the year.

The Frugal Muse started to sell at 5,000 books at January and two months later, it slightly increased to nearly 10,000 books. After March, it showed the decrease to about 1,000 books from March to May. After May, it began to moderately increased between 15,000 books to 20,000 books. By the December, it rocketed to above 35,000 books, becoming the highest selling bookshop among the three bookshops.

In conclusion, The Frugal Muse started being the lowest in january to the highest selling bookstore by the December.

Word Count: 201

Answers On The Same Topic:

The graph shows the total number of books sold at three bookshops in Bayside City last year. Summarize the information by selecting and reporting the main features, and make comparisons where relevant.

The line graph illustrates the number of books in total, which was sold at three different bookshops, namely Barnes & Noble, Cozy Corner and Frugai Muse, in a city named Bayside the previous year. Overall, it is clear that all three bookshops recorded an upward trend, while Cozy Corner experienced a volatile trajectory in the […]

The graph shows the total number of books sold at three bookshops in Bayside City last year. Summarize the information by selecting and reporting the main features, and make comparisons where relevant.

The line graph presents the number of books sold at three bookshops in Bayside City to a spesific January to December. Overall, the total number of sold was inconsistent throughout the given period. The highest sold was in Barnes & Noble bookshop on December by selling approximately 42.000 books in a month and the lowest […]

The graph shows the total number of books sold at three bookshops in Bayside City last year. Summarize the information by selecting and reporting the main features, and make comparisons where relevant.

The line graph showing difference in sales for three books in Bayside city between January and December. It is noticeable from the graph that people in Bayside city love reading books. Although at the beggining the purchase was low, the sales at the end of the year had increased for the three books. Barnes and […]

The graph shows the total number of books sold at three bookshops in Bayside City last year. Summarize the information by selecting and reporting the main features, and make comparisons where relevant.

The line graph illustrates how many books were sold at three bookstores in Bayside City in 2023. Overall, there was a rise in book sales at all bookshops, with Barnes & Noble having the highest figure at the beginning of the year, whereas Frugal Muse was the lowest. Moreover, sales of books at Frugal Muse […]

See All

Other Topics:

The graph below shows the number of undergraduate students enrolled in five different humanities and social science disciplines in UK universities from 1985 to 2015. Summarise the information by selecting and reporting the main features and make comparisons where relevant.

The line graph represents the amount of undergraduates registered in five various humanities and social sciences disciplines in UK universities between 1985 and 2015. Overall, the number of students enrolled in law showed the most significant growth throughout the period. Political Science marginally increased and fell over the period, while ethics had constant upward trend. […]

The line graph below shows the percentage of people using the Internet in five different countries from 2000 to 2020

The line graph illustrates the proportion of people using Internet in five different countries between 2000 to 2020. Overall, the use of Internet has increased in every country in twenty years. The most dramatical change in the percentage of people was in India followed up by Germany. In 2000, India had almost no usage of […]

The graph shows how much money was spent on foreign investment in real estate for four Asian countries from 2014 to 2024.

The line graph illustrates the amount of earnings being spent on foreign investment in housing for four various Asian nations between 2014 and 2024. A glance at the graph reveals that Japanese’s investment upsurged whereas Chinese’s investment plumped throughout the provided timeframe. As regards the Singaporians, their investment decreased gradually while Korean’s fluctuated over the […]

The line graph shows the number of overseas visitors to three different areas in a European country between 1987 and 2007. Summarise the information by selecting and reporting the main features, and make comparisons where relevant.

The data illustrates overseas visitors to three several areas in a European country from 1987 to 2007. Overall, proportion of people who visited to the coasts and lakes increased substantially, but with some flactuations, over the period, . The mountains visitors also rose, although the increase was considerably less pronounced. At the first half of […]

The line graph shows the number of overseas visitors to three different areas in a European country between 1987 and 2007. Summarise the information by selecting and reporting the main features, and make comparisons where relevant.

The given line graph compares the changes in the number of tourists visiting European country areas in a 20-year period starting from 1987. Overall, all three visiting lands gained popularity over the time, ending with the coast dominance, followed by the lakes and the mountains. While the figure for the coast and the lakes had […]

The line graph show the average number of weekly patients visiting four clinics of a hospital from 2010 to 2016. Summarise the information by selecting and reporting the main features, and make comparisons where relevant. Write at least 150 words.

The line graph illustrates the average weekly number of patients visiting four different clinics at a hospital between 2010 and 2016. Overall, the eye clinic experienced by far the most substantial growth and became the busiest clinic by 2016. In contrast, the birth-control clinic fluctuated considerably, although its figure returned to its initial level at […]

See All
We have detected unusual activity on your device.
Please verify your identity to continue.
Note: This verification step won't sign you in. If you have a premium account, please log in to access the service as usual.
Google/Gmail Verification
Or verify using Email/Code
We've sent a verification code to:
youremail@gmail.com (Not your email?)
Enter it below to complete the verification process.
Ensure your email address is correct, your inbox is not full, and you check your spam folder. If no email arrives, consider using an alternative email.
You will need a Premium plan to perform your action!
Note: If you already have a premium account, please log in to access our services as usual.

Plans & Pricing

Our mission is to make quality education accessible for everyone.
However, to keep our hardworking team running and this service alive, we genuinely need your support!
By opting for a premium plan, not only do you sustain us in achieving the mission, but you also unlock advanced features to enrich your learning experience.

Free

For learners who aren't pressed for time

What's included on Free
100+ Cambridge IELTS Tests
Instant IELTS Writing Task 1 & 2 Evaluation (2 times/month)
Instant IELTS Speaking Part 1, 2, & 3 Evaluation (2 times/month)
Instant IELTS Writing Task 1 & 2 Essay Generator (2 times/month)
500+ Dictation & Shadowing Exercises
100+ Pronunciation Exercises
Flashcards
Other Advanced Tools

Premium

For those serious about advancing their English proficiency, and for IELTS candidates aspiring to boost their band score by 1-2 points (especially in writing & speaking) in just 30 days or less

What's included on Premium
Save Your IELTS Test Progress & Analyze Mistakes By Question Type
Save Your Own Flashcard Sets & Use Them On Any Device
Unlock All Courses, IELTS Tests, Section & Part Practice
Unlimited AI Conversations
Unlimited AI Writing Enhancement Exercises
Unlimited IELTS Writing Task 1 & 2 Evaluation
Unlimited IELTS Speaking Part 1, 2, & 3 Evaluation
Checked Answers Will Not Be Published
Unlimited IELTS Writing Task 1 & 2 Essay Generator
Unlimited IELTS Speaking Part 1, 2, & 3 Sample Generator
Unlimited Usage Of Advanced Tools & AI Features
Priority Support within 24h (12-month plan only)

Due to the nature of our service and the provided free trials, payments are non-refundable.