Our system will evaluate the answer based on this AI-generated description.
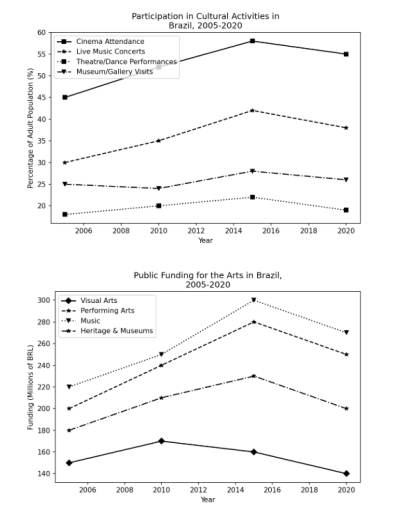
The image features two line graphs spanning years 2005, 2010, 2015, and 2020. The top graph, titled "Participation in Cultural Activities in Brazil, 2005-2020", has the y-axis labelled "Percentage of Adult Population (%)" (ranging from below 20 to 60) and x-axis "Year": Cinema Attendance (45% in 2005, 52% in 2010, 58% in 2015, 55% in 2020), Live Music Concerts (30% in 2005, 35% in 2010, 42% in 2015, 38% in 2020), Museum/Gallery Visits (25% in 2005, 24% in 2010, 28% in 2015, 26% in 2020), and Theatre/Dance Performances (18% in 2005, 20% in 2010, 22% in 2015, 19% in 2020). The bottom graph, titled "Public Funding for the Arts in Brazil, 2005-2020", has the y-axis labelled "Funding (Millions of BRL)" (ranging from 140 to 300) and x-axis "Year": Music (220 in 2005, 250 in 2010, 300 in 2015, 270 in 2020), Performing Arts (200 in 2005, 240 in 2010, 280 in 2015, 250 in 2020), Heritage & Museums (180 in 2005, 210 in 2010, 230 in 2015, 200 in 2020), and Visual Arts (150 in 2005, 170 in 2010, 160 in 2015, 140 in 2020).
Given the complexity of the image, the above description may not be entirely accurate.
Skyrocket your IELTS band score by 1-2 points in under a month with our premium plan!
Note: Both the topic and the answer were created by one of our users.
The line graphs compare public investment for the arts and the proportion of population which attended three cultural venues in Canada from 2000 to 2020.
Overall, federal government funded the highest amount of money for arts and culture, followed by provincial, and the least amount was provided by the municipal government. In addition, museums welcomed the highest share of population, while art galleries recieved the least over the time period.
Notably, arts and culture were funded with 3.5 billions of CAD in 2000, which steadily rose to 4.3 billions of CAD in 2010 and eventually 5 billions of CAD in 2020. Similarly, provincial government invested 3 billions of CAD, which grew to 3.2 billions of CAD in 2010, and culminated to 4 billions of CAD in 2020. Municipal government also increased their funding, however there was a slight decline from 2005 to 2025.
Initially, slightly less than 42.5% attended museums in 200, which peaked at almost 45% in 2010, but fell around 37.5% at the end of the period. Performing arts began with 35% attendance in 2000, and after a marginal increase until 2005, it dropped to 30% by 2020. However, art galleries started with a little bit more than 27.5% in 2000, and after a peak in 2010 at around 30% , decreased to less than where it started in 2020.
Word Count: 222
