Our system will evaluate the answer based on this AI-generated description.
The image displays two visualizations: the first graph depicts value changes in the UK steel industry from 1970 to 2000 with three lines, starting in 1970 with total UK demand at 100,000 units, UK production at about 95,000 units, and import figures at 5,000 units; by 1980, total UK demand falls to around 90,000 units, UK production drops to approximately 62,000 units, and imports increase to 28,000 units; in 1990, total UK demand stabilizes at 85,000 units, UK production further decreases to 55,000 units, and imports rise to 30,000 units; by 2000, total UK demand reaches 75,000 units, UK production is around 50,000 units, and imports are at 25,000 units; the second chart illustrates employment status in the UK steel industry from 1970 with employment at 230,000, which reduces to 160,000 by 1980, declines to approximately 140,000 by 1990, showing a final decrease to 100,000 by 2000.
Given the complexity of the image, the above description may not be entirely accurate.
Skyrocket your IELTS band score by 1-2 points in under a month with our premium plan!
Note: Both the topic and the answer were created by one of our users.
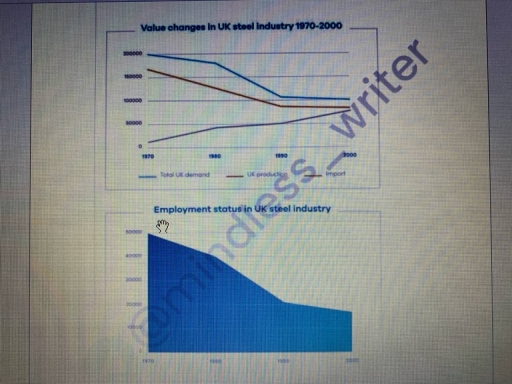
The line graphs display the modifications in the UK steel manufacturing from 1970 to 2000.
It is evident that the UK industry initially began with its highest rate, but it fell down year by year. In addition, the industry is classified into 2 groups, ‘Value changes in UK steel industry’ and ‘Employment status in UK steel industry’.
Examining on the first group, it is divided to 3 movements: total UK demand, UK production and import. The total UK request in 1970, fell down from 200000 ton to 100000 ton in 2000. The UK production was 40000 ton lower than the UK request in 1970, then it slightly declined to 80000 ton in 2000. Lastly, the import industry increased from 0 to 70000 until 2000. It is imperative to say that three movements have almost gone in the same direction in 2000.
Turning to Employment status, the number of employees was 50000 at first. However, it lessened to 40000 in 1980. In 1990, the rate of workers immediately reduced to 20000 as well as 18000 employees in 2000.Furthermore, the condition of industry was originally well, nevertheless it faced to a massive bend in 2000.
Word Count: 193
