🔥 Today Only: Save 30% on Premium — Offer Ends Soon! - Upgrade Now!
Map

Band 6+: The images illustrate the layout of the town/city called Lakeside from 2000 to 2009/ over a span of 9 years(2000-2009).The images illustrate the layout of the town/city called Lakeside from 2000 to 2009/ over a span of 9 years(2000-2009).

Image for topic: The images illustrate the layout of the town/city called Lakeside from 2000 to 2009/ over a span of 9 years(2000-2009).The images illustrate the layout of the town/city called Lakeside from 2000 to 2009/ over a span of 9 years(2000-2009).
Our system will evaluate the answer based on this AI-generated description.
The image shows two side-by-side maps labeled "Lakeside 2000" and "Lakeside 2009" with a compass indicating North at the top of each map. In "Lakeside 2000," the map features a lake with an "Old Town" to its left, a "Derelict warehouse" above the lake, a "Residential area" to the right of the lake and above the "Old Town," an "Art Centre" below the "Old Town," a "School" below the "Art Centre," a "Residential area" below the "School," an "Industrial complex" to the right of the "Residential area" and below the lake, and another "Residential area" below the "Industrial complex," all areas separated by a wavy "River" running from the bottom left to top right of the map. In "Lakeside 2009," the same wavy "River" runs through the map, the previous "Lake" is now a "Pond," the "Old Town" and "Derelict warehouse" have been replaced by "University" and "Offices" respectively, the "Residential area" to the right of the "Pond" remains, the "School" is in the same position but now has a "Cinema" above it, the "Art Centre" has been replaced by a "Shopping centre," the "Residential area" below the "School" remains, the "Industrial complex" remains in the same position, and the "Residential area" below the "Industrial complex" also remains.
Given the complexity of the image, the above description may not be entirely accurate.
Note: Both the topic and the answer were created by one of our users.

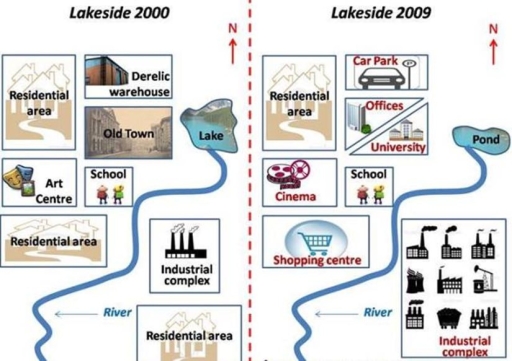
The two images compare the layout of the city Lakeside over almost a decade.

Overall, it can be observed that the residential area occupied the most in 2000, but gradually it diversified, allowing other industries to expand in 2009. The River divides the area into two parts, North-West with 80% of land and South-East with 20%.

In 2000, the north-West part has major sectors serving the civilization. Residential area occupied the most and school occupied the least. Derelic warehouse was present behind the lake. Industrial area was located at the other side of the river. moreover the river connects to the lake at the north side.

In 2009, there were significant changes starting with Derelic warehouse which was replaced with the car park and the old town with offices and universities. The art centre was repurposed as Cinema theater behind the new shopping centre. While the lake slowly transformed into a pond. Finally the industrial area at the opposite side witnessed major expansion

Word Count: 163

Answers On The Same Topic:

The images illustrate the layout of the town/city called Lakeside from 2000 to 2009/ over a span of 9 years(2000-2009).The images illustrate the layout of the town/city called Lakeside from 2000 to 2009/ over a span of 9 years(2000-2009).

There are two images which illustrates that how an lakeside is beig updated from 2000 to 2009. Overall, it can be seen in the both pictures that in years there has been lots of development which has been done year by year for instance, car parking, art centre, cinema and much more. On the one […]

The images illustrate the layout of the town/city called Lakeside from 2000 to 2009/ over a span of 9 years(2000-2009).The images illustrate the layout of the town/city called Lakeside from 2000 to 2009/ over a span of 9 years(2000-2009).

The maps illustrate the changes that took place in the town of Lakeside between 2000 and 2009. Overall, the town of Lakeside become more industrial with the construction of business complex and factories. In addition, The left side of the company experienced more changes when compared to right hand. In 200, Lakeside was an active […]

The images illustrate the layout of the town/city called Lakeside from 2000 to 2009/ over a span of 9 years(2000-2009).The images illustrate the layout of the town/city called Lakeside from 2000 to 2009/ over a span of 9 years(2000-2009).

The two maps illustrate the changes that took place in the Lakeside area between the years 2000 and 2009. Overall, Lakeside underwent a significant transformation from a residential and cultural area to a more modern, educational, and commercial one. For example, several old facilities were replaced with new buildings, such as a university, a cinema, […]

See All

Other Topics:

The maps below show the development of a local museum and its surroundings between 2010 and 2024. Summarize the information by selecting and reporting the main features, and make comparisons where relevant.The maps below show the rooms that change from 5 years ago to current

The two maps illustrate the changes after improvment of local museum from 2010 to 2024. Overall, it is clear that new areas were added to the museum, while some old areas were expanded or remianed unchanged such as road after renovation. In 2010, there were a car park in the west side of local museum, […]

The map below shows the development of an area between 1995 and the present. Summarize the information by selecting and reporting the main features and make comparisons where relevant.

The maps illustrate how a certain area has been developed since 1995. Overall, due to a major transformation, the area has gone from a sparsely populated coastal spot to a built-up residential town. Notably, the changes can be observed in road infrastructure and accommodations along with newly built recreational facilities. Prior to the redevelopment, there […]

The maps below show a beachfront area in Australia in 1950 and today. Summerise the information by selecting and reporting the main features and make comparison where relevant

The maps illustrate the development of a beachfront area in Australia between 1950 and the present day. Overall, the area has undergone substantial transformation, with the addition of new infrastructure and amenities. While the pavilion and lighthouse have remained intact, the surrounding land has been redeveloped to include more parking spaces, new leisure venues and […]

The diagram below illustrates the current layout and proposed development of the biomedical campus at a university. Provide an overview of the information by identifying and describing the key details and include comparisons where appropriate.

The diagram compares the difference between current layout and planned development of the biomedical campus at a university. Overall, the campus underwent significant changes transforming from a sparse diagram to major variance in proposed development, including the removal of trees and the construction of new buildings. With a cursory can reveal that there are trees […]

The maps below show a rural town as it was 1983 and as it is now. Summarise the information by selecting and reporting the main features, and make comparisons where relevant.

The maps illustrate how a rural town changed between 1983 and the present day. Overall, the town has undergone significant development, including the construction of new housing, commercial buildings, and a dam, while some original structures such as the farm and shop were replaced. At the beginning, from the west entry there is housing on […]

The maps below show the changes in the art gallery ground floor in 2015 and present day. Summarize the information by selecting and reporting the main features, and make comparisons where relevant.The maps below show the changes in the art gallery ground floor in 2005 and present day. Summarize the information by selecting and reporting the main features, and make comparisons where relevant.

The given pictures illustrate information on how basement floor of art gallery has been altered from 2005 up to now.Generally, place witnessed collosal change during the whole period. The most noticable modifications took place on the left side of gallery, starting from the cafe, which was transformed into gallery office. Previously, that office located right […]

See All
We have detected unusual activity on your device.
Please verify your identity to continue.
Note: This verification step won't sign you in. If you have a premium account, please log in to access the service as usual.
Google/Gmail Verification
Or verify using Email/Code
We've sent a verification code to:
youremail@gmail.com (Not your email?)
Enter it below to complete the verification process.
Ensure your email address is correct, your inbox is not full, and you check your spam folder. If no email arrives, consider using an alternative email.
You will need a Premium plan to perform your action!
Note: If you already have a premium account, please log in to access our services as usual.

Plans & Pricing

Our mission is to make quality education accessible for everyone.
However, to keep our hardworking team running and this service alive, we genuinely need your support!
By opting for a premium plan, not only do you sustain us in achieving the mission, but you also unlock advanced features to enrich your learning experience.

Free

For learners who aren't pressed for time

What's included on Free
100+ Cambridge IELTS Tests
Instant IELTS Writing Task 1 & 2 Evaluation (2 times/month)
Instant IELTS Speaking Part 1, 2, & 3 Evaluation (5 times/month)
Instant IELTS Writing Task 1 & 2 Essay Generator (2 times/month)
500+ Dictation & Shadowing Exercises
100+ Pronunciation Exercises
Flashcards
Other Advanced Tools

Premium

For those serious about advancing their English proficiency, and for IELTS candidates aspiring to boost their band score by 1-2 points (especially in writing & speaking) in just 30 days or less

What's included on Premium
Save Your IELTS Test Progress
Unlock All Courses & IELTS Tests
Unlimited AI Conversations
Unlimited AI Writing Enhancement Exercises
Unlimited IELTS Writing Task 1 & 2 Evaluation
Unlimited IELTS Speaking Part 1, 2, & 3 Evaluation
Checked Answers Will Not Be Published
Unlimited IELTS Writing Task 1 & 2 Essay Generator
Unlimited IELTS Speaking Part 1, 2, & 3 Sample Generator
Unlimited Usage Of Advanced Tools
Priority Support within 24h (12-month plan only)

Due to the nature of our service and the provided free trials, payments are non-refundable.
Nếu bạn là người Việt Nam và không có hoặc không muốn trả bằng credit/debit cards, bạn có thể thanh toán bằng phương thức chuyển khoản:


Chọn gói:
419,000₫ 277,000 ₫ cho gói 1 tháng (chỉ 9,233₫/ngày)
1,239,000₫ 597,000 ₫ cho gói 3 tháng (chỉ 6,633₫/ngày)
2,469,000₫ 1,027,000 ₫ cho gói 6 tháng (chỉ 5,706₫/ngày)
4,929,000₫ 1,417,000 ₫ cho gói 12 tháng (chỉ 3,936₫/ngày)


Sau khi chuyển khoản, vui lòng đợi trình duyệt tự động điều hướng bạn trở lại Engnovate và bạn sẽ ngay lập tức nhận được mã kích hoạt tài khoản premium.
Nếu có lỗi xảy ra, bạn có thể liên hệ với team thông qua một trong các phương thức: email đến helloengnovate@gmail.com hoặc nhắn tin qua facebook.com/engnovate.
Vì toàn bộ công cụ trên website đều có thể sử dụng thử miễn phí, Engnovate không hỗ trợ hoàn tiền.