Our system will evaluate the answer based on this AI-generated description.
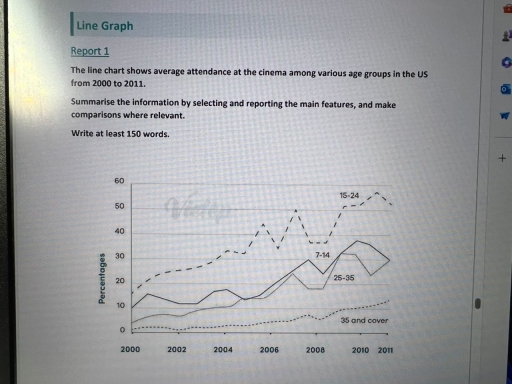
The image displays a line graph depicting average cinema attendance percentages among various age groups in the US from 2000 to 2011. Four age groups are represented: "15-24," "7-14," "25-35," and "35 and over." Key data points include: In 2000, ages 15-24 began just below 50%, ages 7-14 around 35%, ages 25-35 near 30%, and ages 35 and over at approximately 15%. In 2002, 15-24 peaks just above 50%, while the other groups remain relatively stable with minor fluctuations. By 2004, all groups notably increase, with 15-24 around 60%, 7-14 increasing above 50%, 25-35 near 40%, and 35 and over slightly over 20%. In 2006, a decline is observed in all categories except 35 and over, which sustains. In 2008, further declines continue with 15-24 falling slightly below 50% and the other categories showing a gradual decrease. In 2010, 15-24 slightly recovers but does not exceed 50%, while other groups stabilize or decline modestly. By 2011, all categories experience a minor drop or leveling off, indicating either declining or steady attendance rates without significant recovery.
Given the complexity of the image, the above description may not be entirely accurate.
Skyrocket your IELTS band score by 1-2 points in under a month with our premium plan!
Note: Both the topic and the answer were created by one of our users.
The provided line chart compares the information about the percentage of different age group people who attended cinema in Great Britain over the period of 20 years, starting from 1984.
Looking from an overall perspective, it is clearly apparent that cinema attendance grew in all ages group in the given period. Noticeably, the age group of 15 to 24 was the highest trend to went cinema compared to other groups.
Look at that chart in more detail, in terms of 1984. Nearly 20% of (15-28) age group went in cinema, which was rose significantly over 60% in 2003. However, the proportion of around 2% ( 35 plus) went in cinema in the beginning year and reached over the 10% in final period.
For the remaining groups, in the case of cinema attendance of (7 -14) and (25 -35)age group followed similar proportion, stood at nearly 10% and 5% in 1984 and reached around 40% and 50% respectively in 2002, although some fluctuation over the period. By the year of 2003, the age group of( 7-14 )went cinema declined sharply ,at 40%, and the age of( 25 -35) were remained stable.
Word Count: 190
