🔥 Today Only: Save 30% on Premium — Offer Ends Soon! - Upgrade Now!
Multiple Graphs

Band 8+: The line graph below gives information about the number of foreign students in Japan from 1985 to 2003. The pie chart shows the distribution of foreign students in Japan by region and country of origin in 2003. Summarise the information by selecting and reporting the main features and make comparisons where relevant. Write at least 150 words.

Image for topic: The line graph below gives information about the number of foreign students in Japan from 1985 to 2003. The pie chart shows the distribution of foreign students in Japan by region and country of origin in 2003. Summarise the information by selecting and reporting the main features and make comparisons where relevant. Write at least 150 words.
Our system will evaluate the answer based on this AI-generated description.
The image features a line graph and a pie chart. The line graph depicts the number of foreign students in Japan from 1983 to 2003, with three distinct categories. "Students on MEXT scholarships" numbered 2,502 in 1983, 4,221 in 1990, 7,771 in 1995, 8,374 in 2000, 9,100 in 2001, 9,379 in 2002, and 9,612 in 2003. "Privately-financed students" started at 11,173 in 1983, rose to 36,298 in 1990, 45,236 in 1995, 62,325 in 2000, 77,101 in 2001, 88,279 in 2002, and reached 96,135 in 2003. "Students on foreign government study programs" showed 808 in 1983, increased to 1,782 in 1990, reached 2,274 in 1995, 4,350 in 2000, 4,661 in 2001, 5,204 in 2002, and stood at 5,287 in 2003. The pie chart illustrates the geographical distribution of the students: Asia accounts for 91.7%, with China at 63.5%, Korea at 13.9%, "Other" Asian countries at 14.9%. Next are Europe at 3.1%, North America at 1.8%, Latin America at 1.1%, Near and Middle East at 0.7%, Africa at 1.0%, and Oceania at 0.6%.
Given the complexity of the image, the above description may not be entirely accurate.
Note: Both the topic and the answer were created by one of our users.

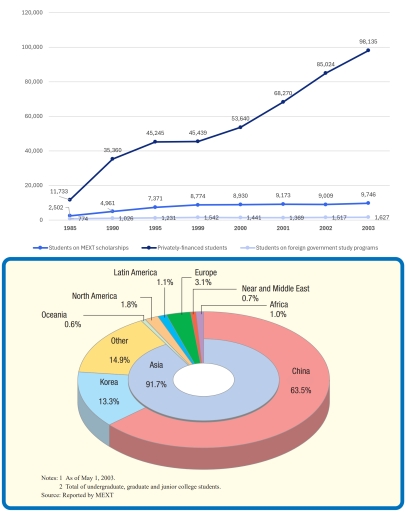
The line chart shows the changes in the number of international students in Japan between 1985 and 2003, while the pie graph provides information on the geographic origin of foreign students in Japan.

Overall, most overseas students in Japan over the given period were self-financed, and foreign students in Japan were mainly from Asian countries by the year of 2003.

During an 18-year period, the number of international students without scholarships in Japan were by far the highest with over 98,000 students by 2003. At the same period, the figure for undergraduates coming to Japan via foreign government study programs only increased slightly from around 770 to 1,627, whereas those with MEXT scholarships gradually climbed from approximately 2,500 to almost 9,750 over 18 years.

Regarding the origin of overseas undergraduates, approximately 92% were from Asia, mainly Korea and China. Students from Europe and the Americas each accounted for about 3%, while those from Africa, Oceania, and the Middle East comprised only 0.6% to 1%.

Word Count: 164

Other Topics:

You should spend about 20 minutes on this task. The pie charts below show how dangerous waste products are dealt with in three countries. Summarise the information by selecting and reporting the main features, and make comparisons where relevant. Write at least 150 words.

The pie charts compare how countries such as the United Kingdom, the Republic of Korea and Sweden manage harmful waste materials using five different methods. Overall, disposing waste by underground, by fire and recyling are the most common ways among five methods used to dispose waste. The United Kingdom prefers incineration method whereas, Sweden buries […]

Task 1: The charts show how satisfied students were with several types of facilities at a university in the UK in the year 2007. Provide an overview of the information by identifying and describing the key details, and include comparisons where appropriate.

The given pie charts illustrate percentage of satisfied students in several types of facilities at a university in the United Kingdom in the year 2007. As an overall trend, the per cent of very satisfied in all facilites including undergraduates and postgraduates represent highest value than other criterias. According to the data, school rooms at […]

The charts below show information about the average spending of a typical household in four different countries in the year 2020.

The pie charts compare the average household spending in four different countries, namely Vietnam, Singapore, the USA, and Bangladesh, in 2020. Overall, food accounts for the largest proportion of expenditure in Vietnam and Bangladesh, whereas in the USA, the biggest share is spent on entertainment. Singapore shows a more balanced distribution across categories. In Vietnam, […]

The graph and table details the information about proportion of graduates in Australia who worked full-time after university in the period between 2004 and 2012

The line graph and table provides information on the proportion of people with a degree working in Australia and compares the average salary of math and other graduates between 2004 and 2012.Overall, less people worked with a university degree throughout the year, with those who had a math degree remaining unchanged. Additionally, while the average […]

The charts show the percentage of volunteers by organizations in 2008-2014. Summarise the information by selecting and reporting the main features, and make comparisons where relevant.

The pie charts illustrate the percentage of facilitating organization such as volunteers over the period from 2008 to 2014. Overall, while all figures experienced changes at different rates, the number of Health Care organizations was the only one that remained stable. It is also clear that the proportions of Sport and and Environmental organizations became […]

The first chart below shows the percentage of school-aged girls and boys who were at secondary school in four regions of the world in 2000. The second chart shows the percentages of college-aged men and women in higher education in the same year.

The two charts compare the proportions of school-aged boys and girls attending secondary school and the percentages of men and women in higher education across four world regions in 2000. Overall, participation in both secondary and higher education varied significantly by region, with developed regions showing higher enrolment rates. In addition, gender disparities were more […]

See All
We have detected unusual activity on your device.
Please verify your identity to continue.
Note: This verification step won't sign you in. If you have a premium account, please log in to access the service as usual.
Google/Gmail Verification
Or verify using Email/Code
We've sent a verification code to:
youremail@gmail.com (Not your email?)
Enter it below to complete the verification process.
Ensure your email address is correct, your inbox is not full, and you check your spam folder. If no email arrives, consider using an alternative email.
You will need a Premium plan to perform your action!
Note: If you already have a premium account, please log in to access our services as usual.

Plans & Pricing

Our mission is to make quality education accessible for everyone.
However, to keep our hardworking team running and this service alive, we genuinely need your support!
By opting for a premium plan, not only do you sustain us in achieving the mission, but you also unlock advanced features to enrich your learning experience.

Free

For learners who aren't pressed for time

What's included on Free
100+ Cambridge IELTS Tests
Instant IELTS Writing Task 1 & 2 Evaluation (2 times/month)
Instant IELTS Speaking Part 1, 2, & 3 Evaluation (5 times/month)
Instant IELTS Writing Task 1 & 2 Essay Generator (2 times/month)
500+ Dictation & Shadowing Exercises
100+ Pronunciation Exercises
Flashcards
Other Advanced Tools

Premium

For those serious about advancing their English proficiency, and for IELTS candidates aspiring to boost their band score by 1-2 points (especially in writing & speaking) in just 30 days or less

What's included on Premium
Save Your IELTS Test Progress
Unlock All Courses & IELTS Tests
Unlimited AI Conversations
Unlimited AI Writing Enhancement Exercises
Unlimited IELTS Writing Task 1 & 2 Evaluation
Unlimited IELTS Speaking Part 1, 2, & 3 Evaluation
Checked Answers Will Not Be Published
Unlimited IELTS Writing Task 1 & 2 Essay Generator
Unlimited IELTS Speaking Part 1, 2, & 3 Sample Generator
Unlimited Usage Of Advanced Tools
Priority Support within 24h (12-month plan only)

Due to the nature of our service and the provided free trials, payments are non-refundable.
Nếu bạn là người Việt Nam và không có hoặc không muốn trả bằng credit/debit cards, bạn có thể thanh toán bằng phương thức chuyển khoản:


Chọn gói:
419,000₫ 277,000 ₫ cho gói 1 tháng (chỉ 9,233₫/ngày)
1,239,000₫ 597,000 ₫ cho gói 3 tháng (chỉ 6,633₫/ngày)
2,469,000₫ 1,027,000 ₫ cho gói 6 tháng (chỉ 5,706₫/ngày)
4,929,000₫ 1,417,000 ₫ cho gói 12 tháng (chỉ 3,936₫/ngày)


Sau khi chuyển khoản, vui lòng đợi trình duyệt tự động điều hướng bạn trở lại Engnovate và bạn sẽ ngay lập tức nhận được mã kích hoạt tài khoản premium.
Nếu có lỗi xảy ra, bạn có thể liên hệ với team thông qua một trong các phương thức: email đến helloengnovate@gmail.com hoặc nhắn tin qua facebook.com/engnovate.
Vì toàn bộ công cụ trên website đều có thể sử dụng thử miễn phí, Engnovate không hỗ trợ hoàn tiền.