Our system will evaluate the answer based on this AI-generated description.
The image displays "Monthly Revenue of Jewelry & Co." with the y-axis showing "thousands of euros" from 0 to 90 in increments of 10, and the x-axis depicting months from January to December. Four shops are represented: Shop 1 (triangle symbol), Shop 2 (circle symbol), Shop 3 (square symbol), and Shop 4 (diamond symbol). Shop 1 starts at 40, steadily increases, dips below 60 in April, peaks at 80 in May, decreases to below 60 in July, exceeds 70 in August, drops to 60 in September, and surpasses 80 in December. Shop 2 commences at 20, experiences a slight drop in February, rises to over 60 in June, reduces to 50 in August, climbs to 75 in November, and marginally declines in December. Shop 3 starts at 15, steadily ascends to over 70 in October, slightly diminishes in November, and reaches approximately 80 in December. Shop 4 begins at over 10, gradually increases to above 70 in May, drops to around 70 in June, July, and August, ascends to peak at 90 in October and November, and drops to 85 in December.
Given the complexity of the image, the above description may not be entirely accurate.
Skyrocket your IELTS band score by 1-2 points in under a month with our premium plan!
Note: Both the topic and the answer were created by one of our users.
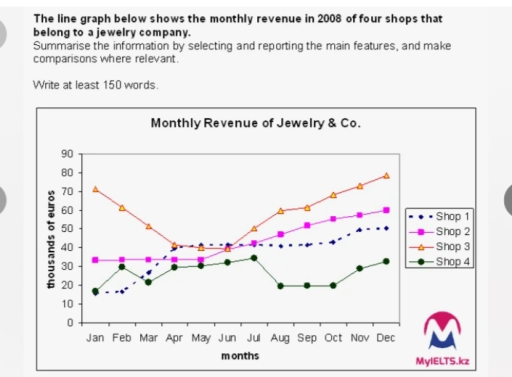
The line graph compares and contrasts data on the changes in the levels of monthly income of four different Jewelry & Co shops over a 12-month period in 2008.
Overall, the revenue rate in all shops showed an upward trend, while shop 3 was leading. Shop 4 demonstrated the lowest figures.
In the first few months of 2008, shop 2 and shop 3 displayed contrasting trends. Shop 2 its starting period had stood at a number of just over 30.000 euros from January to May. Subsequently, this shop saw an upward trend and reached its maximum at over 50,000 euros by December. Shop 3 showed a downward trend. It fell dramatically from over 70,000 to its minimum of 40,000 between January and April, despite this shop had a dramatic growth to its peaking value at 80,000 euros.
Turning to the other two jewelry outlets, shop 1 had the lowest income at first. However, it saw a significant rise to the point of 40.000 in April. This shop stabilized and grew only to about 50,000 in December. Regarding shop 4, it fluctuated between 10,000 and 30,000 showing the lowest results in general. This figure remained stable from August to October.The line graph compares and contrasts data on the changes in the levels of monthly income of four different Jewelry & Co shops over a 12-month period in 2008.
Word Count: 227