Our system will evaluate the answer based on this AI-generated description.
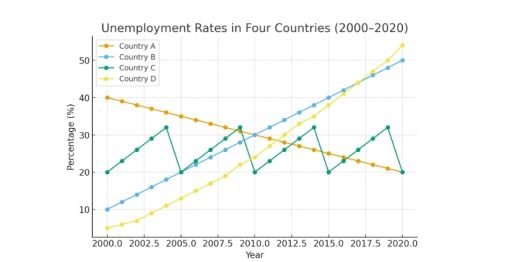
The image displays a line graph titled 'Unemployment Rates in Four Countries (2000-2020)', with the vertical axis representing 'Percentage (%)' and the horizontal axis representing 'Year'. Data for Country A shows the following unemployment rates (%): 2000(40), 2001(39), 2002(38), 2003(37), 2004(36), 2005(35), 2006(34), 2007(33), 2008(32), 2009(31), 2010(30), 2011(29), 2012(28), 2013(27), 2014(26), 2015(25), 2016(24), 2017(23), 2018(22), 2019(21), and 2020(20). Country B's rates (%) are: 2000(10), 2001(12), 2002(14), 2003(16), 2004(18), 2005(20), 2006(22), 2007(24), 2008(26), 2009(28), 2010(30), 2011(32), 2012(34), 2013(36), 2014(38), 2015(40), 2016(42), 2017(44), 2018(46), 2019(48), and 2020(50). Country C's rates (%) for specific years are: 2000(20), 2002(26), 2004(32), 2005(20), 2007(26), 2009(32), 2010(20), 2012(26), 2014(32), 2015(20), 2017(26), 2019(32), and 2020(20). Country D's rates (%) are approximately: 2000(5), 2001(6.5), 2002(8), 2003(9.5), 2004(11), 2005(13), 2006(15), 2007(17), 2008(19.5), 2009(22), 2010(25), 2011(28), 2012(31), 2013(34), 2014(37), 2015(40), 2016(43), 2017(46), 2018(49), 2019(52), and 2020(55).
Given the complexity of the image, the above description may not be entirely accurate.
Skyrocket your IELTS band score by 1-2 points in under a month with our premium plan!
Note: Both the topic and the answer were created by one of our users.
The line graph compares the changing propartions of unemployment individuals in four distinct nations, labled A through D,over the twenty-year preiod starting from 2000.
Overall, it is clear that Country B exprienced a dramatic and consistent upward trend, becooming the Country with the hightest rate of unemploymentbt the end of period. Conversely, Country A shown to steady decline, while Country C and D exhibited highly volatile and fluctuating patterns throughout the two decades.
Looking at the steady trend, Country A started with highest unemployment rate in 2000 at 40%. Over the next twenty years, this figure fell progressively to finish at exactly 20%. In stark contrast, Country B began as the lowest at 10% but climbed steadily, overtaking Country A around 2012 and peaking at 50% in 2000.
Reagarding the remianing nations, Country C and Country D both showed unstable trajectories. Country C peaked twice at roughly 32% before dropping 20% by 2020. Similarly, Country D rose significantly over the period, expriencing various shifts before finishing at appromately 53%.
Word Count: 169
