Our system will evaluate the answer based on this AI-generated description.
The image contains two graphs related to spending by overseas visitors in the UK and reasons for visit in two different years, 1980 and 2010. The first graph, titled "Money spent in the UK by overseas visitors," shows the money spent in millions from 1980 to 2010. The spending starts at around 6,500 million in 1980, reaches approximately 7,500 million in 1985, dips slightly in 1990, jumps to 10,500 million in 1995, fluctuates between 10,000 and 10,500 million from 2000 to 2005, and peaks at around 12,000 million in 2010. The second graph, titled "Reasons for visit," presents pie charts for 1980 and 2010. In 1980, the reasons for visit are distributed as follows: Holidays 41.1%, Business 20.7%, Visiting Friends or Relatives 18.7%, and Other 19.5%. In 2010, the distribution changes to: Holidays 30.1%, Business 22.8%, Visiting Friends or Relatives 28.2%, and Other 19.9%.
Given the complexity of the image, the above description may not be entirely accurate.
Skyrocket your IELTS band score by 1-2 points in under a month with our premium plan!
Note: Both the topic and the answer were created by one of our users.
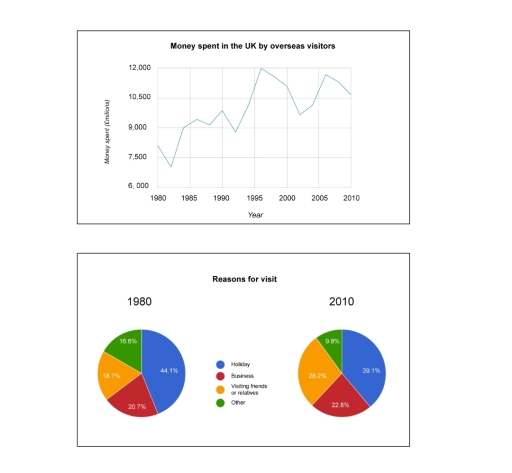
The line graph delineates the amount of money spent by overseas visitors in the UK from 1980 to 2010, and the pie chart presents the purpose of their visits from 1980 to 2010.
Overall, although the amount of money spent fluctuated, the total expenditure by visitors increased over the period, and their reasons for visiting comprised 4 different purposes: holiday, business, visiting friends or relatives, and other.
With regard to total expenditures, in 1980 the total amount of money spent was approximately 7,500 million pounds, and after 10 years the sum of spending reached the range of 10,500 and 9,000 million pounds. Moreover, the expenditure peaked at 12,000 millions, and declined to roughly 10,500 million.
Looking at the pie charts, holiday was the most prevalent reason for traveling in both 1980 and 2010 with 44.1% and 39.1% respectively. Similarly, the other reasons were the least common with 16.6% in 1980 and 9.8% in 2010. Regarding business intentions, the proportions were at 20.7% in 1980, and 22.8% in 2010, while visiting acquaintances at 18.7% in 1980 and 28.2% in 2010.
Word Count: 179
