Our system will evaluate the answer based on this AI-generated description.
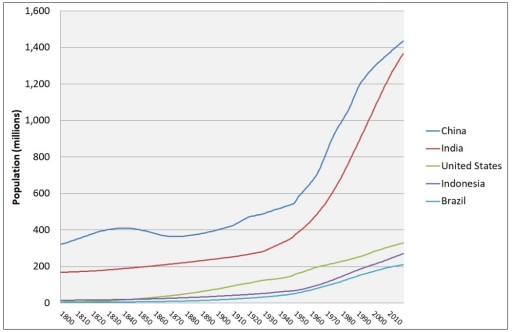
The image displays a line graph representing population in millions from 1800 to 2010 for five countries. The vertical axis, Population (millions), scales from 0 to 1,600, while the horizontal axis indicates years in 10-year increments. The approximate data points for each country are: China (in millions) 1800:320, 1810:350, 1820:380, 1830:400, 1840:410, 1850:410, 1860:380, 1870:360, 1880:370, 1890:380, 1900:400, 1910:420, 1920:470, 1930:500, 1940:520, 1950:560, 1960:650, 1970:820, 1980:980, 1990:1150, 2000:1280, 2010:1420; India (in millions) 1800:160, 1810:170, 1820:175, 1830:180, 1840:190, 1850:200, 1860:210, 1870:220, 1880:230, 1890:240, 1900:250, 1910:260, 1920:270, 1930:300, 1940:350, 1950:400, 1960:500, 1970:600, 1980:750, 1990:920, 2000:1100, 2010:1350; United States (in millions) 1800:5, 1810:7, 1820:10, 1830:13, 1840:17, 1850:23, 1860:31, 1870:40, 1880:50, 1890:63, 1900:76, 1910:92, 1920:106, 1930:123, 1940:132, 1950:151, 1960:179, 1970:203, 1980:227, 1990:250, 2000:282, 2010:310; Indonesia (in millions) 1800:10, 1810:12, 1820:15, 1830:18, 1840:22, 1850:26, 1860:30, 1870:35, 1880:40, 1890:45, 1900:50, 1910:55, 1920:60, 1930:65, 1940:70, 1950:80, 1960:95, 1970:120, 1980:150, 1990:180, 2000:210, 2010:240; Brazil (in millions) 1800:3, 1810:4, 1820:5, 1830:6, 1840:7, 1850:8, 1860:9, 1870:10, 1880:12, 1890:15, 1900:18, 1910:22, 1920:27, 1930:34, 1940:41, 1950:54, 1960:72, 1970:96, 1980:121, 1990:150, 2000:175, 2010:200.
Given the complexity of the image, the above description may not be entirely accurate.
Skyrocket your IELTS band score by 1-2 points in under a month with our premium plan!
Note: Both the topic and the answer were created by one of our users.
The illustrationg displays the difference between different countries’ population.
Overall China and India had the best results among the mentioned candidates, whereas Indonesia, Brazil and The United States had almost the same number. It is hard to point out where is Indonasia’s and Brazil’s statistics is just because they were roughly the same.
According to this line graph, the demographic situation in China was the highest. Ranging from 1800 to 1900 year, there weren’t any noticeable changes and the number of people that lived in this country was around 400 milion. The next century it was observed a rapid rise from 400 milion to 1 400 000 billion residents. In India conditions were pretty similar, but the statistics was growing steadily. From the beggining of 19th century the number of inhabitants was lower than 200 milion and it started to make some slightly changes. Despite some negative aspects, from 1950 there was a dramatic growth that led the number to almost 1.4 billion in 2020. The population in the US began significantly increase from 1860, at this stage the number of people living there was about 50 million. By the 2020 this indicator increased and became a whopping 300 million. Indonesia and Brasil were two countries with the lowest changes and over the provided period the population rose by only 200 milion.
Word Count: 222
