Our system will evaluate the answer based on this AI-generated description.
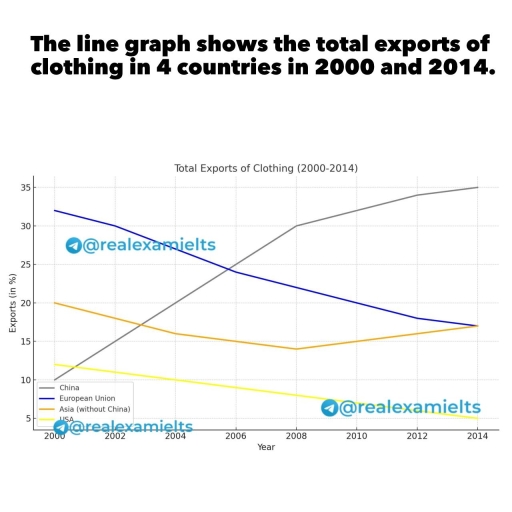
The image presents a line graph detailing total clothing exports in percentages for China, European Union, Asia (excluding China), and USA from 2000 to 2014. In 2000, China is at 6%, European Union at 25%, Asia at 15%, and USA at 10%. By 2002, China slightly increases to 9%, European Union decreases to 24%, Asia at 13%, USA at 8%. In 2004, China's exports rise to 12%, European Union is stable at 23%, Asia increases slightly to 16%, USA drops to 7%. 2006 data shows China reaching 20%, European Union declines to 21%, Asia marginally increases to 18%, USA remains at 6%. In 2008, China sharply rises to 28%, European Union decreases to 20%, Asia at 19%, USA at 5%. By 2010, China's exports are at 30%, European Union steady at 19%, Asia at 20%, USA at 4%. In 2012, China hits 33%, European Union at 18%, Asia at 21%, USA at 3%. Finally, in 2014, China reaches a peak at 33%, European Union at 18%, Asia remains at 21%, and USA declines further to 3%.
Given the complexity of the image, the above description may not be entirely accurate.
Skyrocket your IELTS band score by 1-2 points in under a month with our premium plan!
Note: Both the topic and the answer were created by one of our users.
The line graph compares four countries in terms of exports of clothing between 2010 and 2014. Overall, the four sites experienced different trends in the time period. While the clothing export in China significantly increased, the export in European Union, Asia and USA fell over time with some fluctuations.
As the graph shows, China started from the lowest level at the beginning of the year. Then, it began to increase considerably to 20% in 2006. Also, it continued its upward trends in the next eight years to reach a peak at 35% in 2014. Asia showed a slight reduce with some fluctuations. Initially, it made up 20 % in 2000, followed by small decrease to around 15% in 2008. However, it had a minimal rise to approximetly 17% at the end of the year.
By contrast, the clothing export in European Union and the USA experienced decrease in the 14 years. Regarding to European Union started at from the highest level. Nevertheless, it plunged to 25% in 2006. Also, it continued its downward trend in the next eight years to around 18% in 2014. The percentage of the clothing export in the USA showed a gradual decline. The USA composed almost 13% in 2000. Then, it began to decrease to 5%, which was the lowest level in 2014.
Word Count: 218
