🔥 Today Only: Save 30% on Premium — Offer Ends Soon! - Upgrade Now!
Line Graph

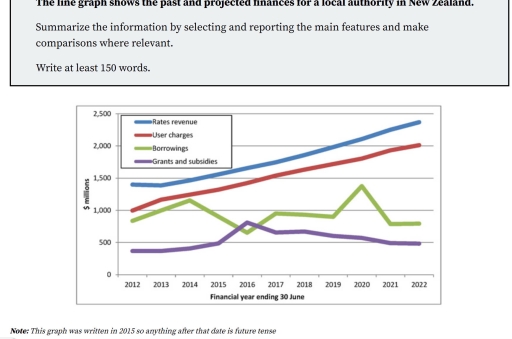
Band 4+: The line graphs shows the past and projected finnances for a local authority in New Zealand.

Image for topic: The line graphs shows the past and projected finnances for a local authority in New Zealand.
Our system will evaluate the answer based on this AI-generated description.
The image presents a line graph of financial data from 2012 to 2022, illustrating four categories: Rates revenue, User charges, Borrowings, and Grants and subsidies, plotted against financial years ending 30 June. In 2012, Rates revenue is about 1,500 million, User charges about 1,000 million, Borrowings approximately 800 million, and Grants and subsidies near 400 million. By 2015, Rates revenue increases to 1,700 million, User charges to 1,200 million, Borrowings drop to below 500 million but spike briefly around 600 million, and Grants and subsidies remain stable around 400 million. By 2018, Rates revenue reaches 2,000 million, User charges 1,400 million, Borrowings decline to under 700 million, and Grants and subsidies slight increase to about 500 million. In 2020, Rates revenue is approximately 2,100 million, User charges about 1,600 million, Borrowings again near 800 million, and Grants and subsidies rest at about 500 million. By 2022, Rates revenue tops at around 2,400 million, User charges climb to 1,800 million, Borrowings stabilize around 600 million, and Grants and subsidies remain flat at 500 million.
Given the complexity of the image, the above description may not be entirely accurate.
Note: Both the topic and the answer were created by one of our users.

The line graph illustrates the perivece years and projected account of finnance for a local authority in zew zaland from 2012 to 2022. the information timeframe period of eleven years.

overall, the four finnanceal arms for local autority, which is rates revenue and user charges in significantly groth as well as campary other factears, while borrowing and grants and suvsidies show a massive fluctuation and margnal increaged over the period.

In1960,the rates revenue at the beagning apoximately 1400 millions over the period account increased rapidly to pic point arrounds 2400 millions at 2022. Thin usercharges opeien 1000 million climed in trends following the years respectively.

on the other hand, borrowings experence massive volatility over the period at closing same leve arround 800 millions while grantesand subsidies increased marginal to arroun 800 millions at 2016.than expereanc marganal decline over the period.

Word Count: 140

Answers On The Same Topic:

The line graphs shows the past and projected finnances for a local authority in New Zealand.

The line graph illustrates the past and projected finances of a local authority in New Zealand from 2012 to 2022, measuring in millions dollars . Overall, rates revenue and user charges show a steady upward trend throughout the period, making them the main sources of income. In contrast, borrowings fluctuate considerably, while grants and subsidies […]

The line graphs shows the past and projected finnances for a local authority in New Zealand.

The given graph illustrates and forecasts the economy in terms of 4 different sources for a particular place in New Zealand Overall, the amount of money in borrowings witnessed an downward trend as opposed to an upward trend which was recorded for the figure for 3 other sources. Furthermore,the rates revenue is an all – […]

See All

Other Topics:

The chart below shows the percentage of households with different kinds of technology in the UK from 1997 to 2001. Summarise the information by selecting and reporting the main features, and make comparisons where relevant.

The line graph illustrates proportion of households with five different types of technology (CD player, Telephone, Computer, Internet, DVD player) in the UK between 1997 to 2001. Overall, it is evident that CD player remained the dominant technology in the UK throughout the period, despite significant fluctuations. Furthermore, while telephone and computer experienced a steady […]

The below line graph shows the percentage of population living in cities.

The line graph illustrates the changes in the population rate of people living in cities in four Asian countries between 1970 and 2020, along with predictions for 2030 and 2040. Overall, all four countries experienced an increase in the urban population, with different trends throughout the decades. To commence, the percentage of the Indonesian population […]

The below line graph shows the percentage of population living in cities.

The line graph illustrates the changes in population rate living in cities in four Asian countries between 1970 and 2020 along with predictions for 2030 and 2040. Overall, all four countries experienced an increase in terms of the urban population with different trends throughout the decades. To commence, the percentage of Indonesian population in 1970 […]

This graph shows the average temperatures in three cities over a two-month period.

The line chart illustrates the mean temperature in Paris, Dubai, and Melbourne throughout the sixty-day timeframe. Overall, the degree of heat in Paris and Duabi grew steadly, whereas Melbourne experienced a minor decline. Paris remained the warmest city across the entire period. It can be observed that the average thermal condition in Paris was around […]

The line graph shows the number of tourists visiting three different countries between 2005 and 2015.

The line graph illustrates the number of visitors three different countries from 2005 to 2015. Overall, it is clear that the number of visitors to country C was at the top of the chart in the first year, while by the end of the period, the number of tourists visiting to country A peaked. Country […]

The graph below shows radio amd television audiences throughout the day in 1992. Summarize the information by selecting and reporting the main features and make comparison where relevant

The graph illustrates radio listeners and television watchers during the day in the UK in 1992. Overall, television was the most watched in the evening, whereas users listened to the radio more in the morning. It is also evident that both media were least used in the early morning. In terms of radio listening, the […]

See All
We have detected unusual activity on your device.
Please verify your identity to continue.
Note: This verification step won't sign you in. If you have a premium account, please log in to access the service as usual.
Google/Gmail Verification
Or verify using Email/Code
We've sent a verification code to:
youremail@gmail.com (Not your email?)
Enter it below to complete the verification process.
Ensure your email address is correct, your inbox is not full, and you check your spam folder. If no email arrives, consider using an alternative email.
You will need a Premium plan to perform your action!
Note: If you already have a premium account, please log in to access our services as usual.

Plans & Pricing

Our mission is to make quality education accessible for everyone.
However, to keep our hardworking team running and this service alive, we genuinely need your support!
By opting for a premium plan, not only do you sustain us in achieving the mission, but you also unlock advanced features to enrich your learning experience.

Free

For learners who aren't pressed for time

What's included on Free
100+ Cambridge IELTS Tests
Instant IELTS Writing Task 1 & 2 Evaluation (2 times/month)
Instant IELTS Speaking Part 1, 2, & 3 Evaluation (2 times/month)
Instant IELTS Writing Task 1 & 2 Essay Generator (2 times/month)
500+ Dictation & Shadowing Exercises
100+ Pronunciation Exercises
Flashcards
Other Advanced Tools

Premium

For those serious about advancing their English proficiency, and for IELTS candidates aspiring to boost their band score by 1-2 points (especially in writing & speaking) in just 30 days or less

What's included on Premium
Save Your IELTS Test Progress & Analyze Mistakes By Question Type
Save Your Own Flashcard Sets & Use Them On Any Device
Unlock All Courses, IELTS Tests, Section & Part Practice
Unlimited AI Conversations
Unlimited AI Writing Enhancement Exercises
Unlimited IELTS Writing Task 1 & 2 Evaluation
Unlimited IELTS Speaking Part 1, 2, & 3 Evaluation
Checked Answers Will Not Be Published
Unlimited IELTS Writing Task 1 & 2 Essay Generator
Unlimited IELTS Speaking Part 1, 2, & 3 Sample Generator
Unlimited Usage Of Advanced Tools & AI Features
Priority Support within 24h (12-month plan only)

Due to the nature of our service and the provided free trials, payments are non-refundable.