🔥 Today Only: Save 30% on Premium — Offer Ends Soon! - Upgrade Now!
Map

Band 5+: the maps below show how a village in the UK developed in 1780, 1860, and 2000.

Image for topic: the maps below show how a village in the UK developed in 1780, 1860, and 2000.
Our system will evaluate the answer based on this AI-generated description.
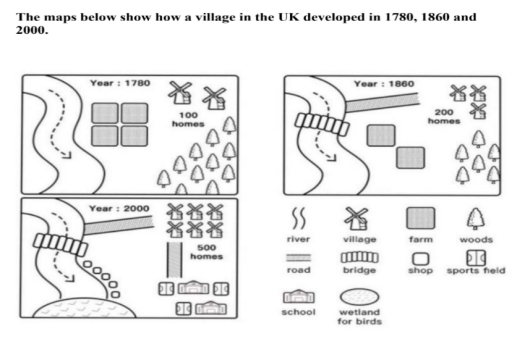
The image displays three developmental stages of a UK village in maps labeled 1780, 1860, and 2000. Year 1780 depicts a river flowing west to east, intersected near its midpoint by a bridge leading to a cluster of four village squares representing 100 homes southeast of the river, adjacent to a collection of eight trees denoting woods with nearby five squares illustrating farms. By 1860, the village expands to encompass seven village squares representing 200 homes positioned more northwest of the river, retaining four farms and expanding the woods to twelve trees. In 2000, the village showcases a substantial expansion to 500 homes indicated by twenty-five village squares, situated directly north of the river, incorporates one shop, one school, and two sports fields to the northeast, while the woods maintain an arrangement of six trees; farms diminish in presence as additional features include a wetland for birds located southeast.
Given the complexity of the image, the above description may not be entirely accurate.
Note: Both the topic and the answer were created by one of our users.

The three maps ilustrate a village in UK from 1780, 1860 and 2000.

Overall the village experienced significant growth over the period. The number of houses increased subtansially, also new facilities such as a bridge, school and sport field were added. While the number of farmland decreased.

In 1780, the village was relatively small, containing only 100 homes in north area. There were also four farm located in the centre, while large area of woodland was located in eastern side of the village. River flowed along the western boundary.

By 1860, the number of houses had doubled to 200. A bridge was built across the river, connecting the village to a new road. On the other hand, the number of farms fell from four to two, moreover the woodland size changed.

In 2000, the village substancal growth, while the number of house rose sharply to 500. Several windmills were added near residential area, and a school as well as sports fields were built in the south section of village. Additionally, the farmland was reduced, leaving only a small number of farms compared with earlier years.

Word Count: 185

Answers On The Same Topic:

the maps below show how a village in the UK developed in 1780, 1860, and 2000.

The three maps showing steady development of the UK outskirts and the way it was filled through the centuries. To commence with, in the 18th centure on the riverside territory there were only four farms between three small villages and a forest. Notiable seen than river havent been used in the first centure, however, in […]

the maps below show how a village in the UK developed in 1780, 1860, and 2000.

Overall, the village experienced significant development over the period, becoming far more urbanised. In particular, the number of homes increased dramatically, while natural areas such as farmland and woodland were gradually reduced to make way for infrastructure and public facilities. In 1780, the village was relatively small and rural in character. It consisted of only […]

the maps below show how a village in the UK developed in 1780, 1860, and 2000.

The maps illustrate the development of a village in the UK in 1780, 1860 and 200. Overall, the village experienced removal, including the chopped down of tree and the addition of building. As can be seen, by 1780, there was 4 larging farm area in the center of village what were been replaced by road […]

the maps below show how a village in the UK developed in 1780, 1860, and 2000.

This map shows us information about village in the UK. And how the village developed in 1780,1860,2000 years. Let’s analyse! 1780 year. In this year it was two villages and 100 homes where. We can see there was river without bridge. It means that individuals there could not cross the river. Also this map shows […]

See All

Other Topics:

The maps below show the present layout of Willowby Village and the proposed changes to the area by 2040. Summarise the information by selecting and reporting the main features, and make comparisons where relevant.

The maps illustrate the current layout of Willowby Village and how it will look by 2040 after several changes. It is evident that at present the village has seven main buildings along with a sports field, under the proposed plan the village will have more residential area and modern facilities like solar system will be […]

The maps depicted the local park, which opened in 1920, and the same park today.

The maps illustrate the changes that have taken place in Grange Park between 1920 and the present day. Overall, the park has undergone substantial modernisation, with several of its original features being removed or replaced by more recreational facilities, most notably a children’s play area, a cafe and a large concert amphitheatre. In addition, the […]

The plan show a school in 1985 and the school now The maps illustrate the layout of a particular school in 1985 and how it looks currently.

There are two images of school building plans compared with each other. The first picture illustrates the school in 1985, and the second one shows the layout of a particular school now, with notable changes. In 1985, the school had massive useless places which decreased citizenship, for instance, a wide road, car parking, and playing […]

The plan show a school in 1985 and the school now The maps illustrate the layout of a particular school in 1985 and how it looks currently.

There is two images of school buildings plan compared with each other.In the first picture illustrated school in 1985 year,and in second one the layout of a particular school now with the noteable changing.In 1985 year the school had a massive useless places which deacrease citizenship, for instant widerly road,car parking and playing fields.And now […]

The diagrams below show the changes that occurred around a school between 1990 and 2010. Summarize the information by selecting and reporting the main features and make comparisons where relevant.

The illustrations display how changes are committed in school over the period of 1990 and 2000. Overall, despite some changes that includes , replacement of farmland with sports field and houses with car park and shops, institute have same buildings and road over the period time given. In 1990, there was a school building across […]

The maps below shows a plan of a city in 1950 and at the present. Summarise the information by selecting and reporting the main features, and make comparisons where relevant.

The maps illustrate the development plan of a city in 1950 and at the present day. Overall, it is obvious that the city has undergone spectacular transformation after the development plan, most significantly, there has been surge in the population after the expansion of residential area and transportation facilities all around the city along with […]

See All
We have detected unusual activity on your device.
Please verify your identity to continue.
Note: This verification step won't sign you in. If you have a premium account, please log in to access the service as usual.
Google/Gmail Verification
Or verify using Email/Code
We've sent a verification code to:
youremail@gmail.com (Not your email?)
Enter it below to complete the verification process.
Ensure your email address is correct, your inbox is not full, and you check your spam folder. If no email arrives, consider using an alternative email.
You will need a Premium plan to perform your action!
Note: If you already have a premium account, please log in to access our services as usual.

Plans & Pricing

Our mission is to make quality education accessible for everyone.
However, to keep our hardworking team running and this service alive, we genuinely need your support!
By opting for a premium plan, not only do you sustain us in achieving the mission, but you also unlock advanced features to enrich your learning experience.

Free

For learners who aren't pressed for time

What's included on Free
100+ Cambridge IELTS Tests
Instant IELTS Writing Task 1 & 2 Evaluation (2 times/month)
Instant IELTS Speaking Part 1, 2, & 3 Evaluation (2 times/month)
Instant IELTS Writing Task 1 & 2 Essay Generator (2 times/month)
500+ Dictation & Shadowing Exercises
100+ Pronunciation Exercises
Flashcards
Other Advanced Tools

Premium

For those serious about advancing their English proficiency, and for IELTS candidates aspiring to boost their band score by 1-2 points (especially in writing & speaking) in just 30 days or less

What's included on Premium
Save Your IELTS Test Progress & Analyze Mistakes By Question Type
Save Your Own Flashcard Sets & Use Them On Any Device
Unlock All Courses, IELTS Tests, Section & Part Practice
Unlimited AI Conversations
Unlimited AI Writing Enhancement Exercises
Unlimited IELTS Writing Task 1 & 2 Evaluation
Unlimited IELTS Speaking Part 1, 2, & 3 Evaluation
Checked Answers Will Not Be Published
Unlimited IELTS Writing Task 1 & 2 Essay Generator
Unlimited IELTS Speaking Part 1, 2, & 3 Sample Generator
Unlimited Usage Of Advanced Tools & AI Features
Priority Support within 24h (12-month plan only)

Due to the nature of our service and the provided free trials, payments are non-refundable.