🔥 Today Only: Save 30% on Premium — Offer Ends Soon! - Upgrade Now!
Map

Band 7+: The maps below show the changes experienced by the town of Lakeside at the beginning of the 21st Century. Summarise the information by selecting and reporting the main features, and make comparisons where necessary.

Image for topic: The maps below show the changes experienced by the town of Lakeside at the beginning of the 21st Century. Summarise the information by selecting and reporting the main features, and make comparisons where necessary.
Our system will evaluate the answer based on this AI-generated description.
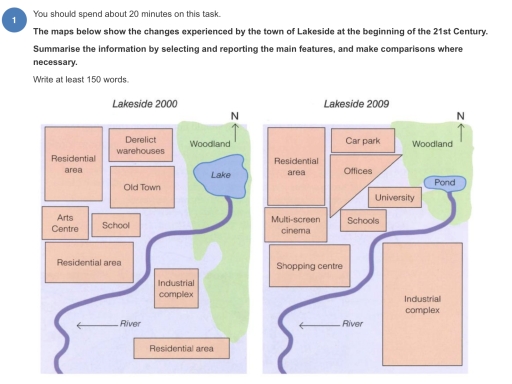
The image presents two maps comparing the town of Lakeside between the years 2000 and 2009. The maps are oriented with a north indicator. In the 2000 map, the town comprises a large lake in the center, surrounded by the Old Town and residential areas. Notably, there's a derelict warehouse zone adjacent to the Old Town. A river flows alongside and partly encircles the town’s southern boundary. The south-west section includes an industrial complex and another residential area. A central residential zone sits south of the lake, while an Arts Centre and School are located in the south-east. By 2009, Lakeside underwent several changes. While the lake and river maintain their presence, the derelict warehouses have been replaced by a car park, offices, and a university. The original woodland near the lake remains unchanged, but a new pond appears east of the lake. The multi-screen cinema and shopping center are new additions, located adjacent to the river in what was a simple, unlabeled expansion space. The south-western industrial complex and southern residential zones appear unaltered. The Arts Centre of 2000 has been replaced, or possibly incorporated, with schools in the 2009 map. Such transformations reflect urban redevelopment focusing on enhancing educational facilities and commercial activity while maintaining some green spaces like woodland and adding new water features such as the pond.
Given the complexity of the image, the above description may not be entirely accurate.
Note: Both the topic and the answer were created by one of our users.

The two maps illustrate how the town of Lakeside has developed over a nine-year period.

Overall, the area has undergone significant changes, transforming from a place with numerous leisure facilities into an area with more workplaces and educational institutions.

In 2000, the residential area was located in the northwest of the town, next to both derelict warehouses and the old town. Additionally, the arts centre and the school were situated between two leisure areas, offering convenient access for local residents. On the left side of the map, a river flows from a lake originating in a woodland. Meanwhile, an industrial complex and another residential zone were located nearby.

By 2009, considerable changes had been made. The old town and derelict warehouses were demolished and replaced by new structures, including a car park, offices, a university, and additional schools. Moreover, the lake was transformed into a pond in the northeast of the town. Furthermore, a multi-screen cinema and a shopping centre were constructed in the centre of the map, replacing the arts centre and a residential area. The industrial complex in the southeast remained unchanged.

Word Count: 184

Answers On The Same Topic:

The maps below show the changes experienced by the town of Lakeside at the beginning of the 21st Century. Summarise the information by selecting and reporting the main features, and make comparisons where necessary.

The maps illustrate some changes to the town of Lakeside over a period of ten years. Overall, the town experienced considerable transformations throughout the timeframe shown. The most noticeable differences between two maps are the expansion of industrial complex and the disappearance of residential area in the southern. As can be seen from the maps […]

The maps below show the changes experienced by the town of Lakeside at the beginning of the 21st Century. Summarise the information by selecting and reporting the main features, and make comparisons where necessary.

On the given map, it is shown the changes of Lakeside from 2000 to 2009. We can see that a lot of things have changed in 9 years. First of all, n the map of 2000, woodland used to take 1/4 of the map, and there was a large lake in it. But on the […]

The maps below show the changes experienced by the town of Lakeside at the beginning of the 21st Century. Summarise the information by selecting and reporting the main features, and make comparisons where necessary.

The diagrams illustrate how the the layout of the town of Lakeside transformed between 2000 and 2009. Overall, Lakeside town witnessed the expansion of the industrial complex and several areas of the town were converted for other purposes. As can be seen from the maps, the northwest accommodation remained unchanged, while the derelict warehouse was […]

The maps below show the changes experienced by the town of Lakeside at the beginning of the 21st Century. Summarise the information by selecting and reporting the main features, and make comparisons where necessary.

The two maps illustrate the changes that took place in the town of Lakeside over a nine-year period, from 2000 to 2009. Overall, Lakeside town underwent vastly transformations, shifting from a mostly developed area, which was only included some basic essential amenities such as schools and dwelling places into a more industrialized and well-equipped land […]

The maps below show the changes experienced by the town of Lakeside at the beginning of the 21st Century. Summarise the information by selecting and reporting the main features, and make comparisons where necessary.

The both maps depict the changes the town of Lakeside experienced from 2000 to 2009. Overall, over the nine-year period, many buildings were replaced with new ones, amenities and infrastructure increased. In 2000, Lakeside had three residental areas – big one in the northeast, medium one in the centre of the area, and small one […]

See All

Other Topics:

The layouts below show a city park before modifications and the same current park.

The given maps illustrate city park before and after transformation and let us investigate the differences between two versions. Overall, compared to the previous version, the modern park has much more infrastructure not only for leisure activity, that is nowadays presented on the left part of the park, but also for sport activity on the […]

Summarize the changes in the Layout of the Woodwards University in 1985 and now

The two maps illustrate information regarding modern and new facilities in Woodward university building area from 1985 to now. Overall, some buildings were expended and new and modern buildings were built, which resulted in the disappearance of many buildings. In addition, the green space appeared and it became eco-friendly. In 1985, there was an admin […]

The two maps show Kingston's University Hospital in 1990 and 2020.

The map illustrates huge developments that taken place in Kingston’s University Hospital over the period 1990-2020. Overall, a substantial change occured in the hospital’s area, particularly on the eastern side of the map compared to western side. In 2020, It can be seen that the north-east of the blueprint, the university hospital expanded into two […]

The diagrams below show the changes that took place in a coastal area called Pentland between 1950 and 2007. Provide an overview of the information by identifying and describing the key details, and include comparisons where appropriate.

The two maps illustrate the changes of Pentland took place in a coastal area over a 57-year period from 1950 to 2007 Overall, it is obvious that Pentland underwent a significant modernization, from a rural area dominated by grassland and industry into a coastal resort. Most noticeably, the expansion of resident areas and shopping facilities. […]

The diagrams below show the changes that took place in a coastal area called Pentland between 1950 and 2007. Provide an overview of the information by identifying and describing the key details, and include comparisons where appropriate.

The two maps illustrate the significant transformations that occurred in a coastal town named Pentland between 1950 and 2007. Overall, Pentland underwent a complete transformation from a sparsely populated, rural area dominated by grassland and industry into a fully developed coastal resort. The town’s development was characterized by the expansion of residential and shopping facilities. […]

The diagrams below give information about two road tunnels in two Australian cities.Summarise the information by selecting and reporting the main features and make comparisons where relevant.

The diagram illustrate the key construction features of two road tunnels located in different Australian cities. Overall, the two tunnels differ considerably in cost, construction time, dimensions and traffic capacity. Although Tunnel A took longer and cost less to build, it is smaller and carries fewer vehicles than Tunnel B. Starting with the construction process, […]

See All
We have detected unusual activity on your device.
Please verify your identity to continue.
Note: This verification step won't sign you in. If you have a premium account, please log in to access the service as usual.
Google/Gmail Verification
Or verify using Email/Code
We've sent a verification code to:
youremail@gmail.com (Not your email?)
Enter it below to complete the verification process.
Ensure your email address is correct, your inbox is not full, and you check your spam folder. If no email arrives, consider using an alternative email.
You will need a Premium plan to perform your action!
Note: If you already have a premium account, please log in to access our services as usual.

Plans & Pricing

Our mission is to make quality education accessible for everyone.
However, to keep our hardworking team running and this service alive, we genuinely need your support!
By opting for a premium plan, not only do you sustain us in achieving the mission, but you also unlock advanced features to enrich your learning experience.

Free

For learners who aren't pressed for time

What's included on Free
100+ Cambridge IELTS Tests
Instant IELTS Writing Task 1 & 2 Evaluation (2 times/month)
Instant IELTS Speaking Part 1, 2, & 3 Evaluation (2 times/month)
Instant IELTS Writing Task 1 & 2 Essay Generator (2 times/month)
500+ Dictation & Shadowing Exercises
100+ Pronunciation Exercises
Flashcards
Other Advanced Tools

Premium

For those serious about advancing their English proficiency, and for IELTS candidates aspiring to boost their band score by 1-2 points (especially in writing & speaking) in just 30 days or less

What's included on Premium
Save Your IELTS Test Progress & Analyze Mistakes By Question Type
Save Your Own Flashcard Sets & Use Them On Any Device
Unlock All Courses, IELTS Tests, Section & Part Practice
Unlimited AI Conversations
Unlimited AI Writing Enhancement Exercises
Unlimited IELTS Writing Task 1 & 2 Evaluation
Unlimited IELTS Speaking Part 1, 2, & 3 Evaluation
Checked Answers Will Not Be Published
Unlimited IELTS Writing Task 1 & 2 Essay Generator
Unlimited IELTS Speaking Part 1, 2, & 3 Sample Generator
Unlimited Usage Of Advanced Tools & AI Features
Priority Support within 24h (12-month plan only)

Due to the nature of our service and the provided free trials, payments are non-refundable.