🔥 Today Only: Save 30% on Premium — Offer Ends Soon! - Upgrade Now!
Map

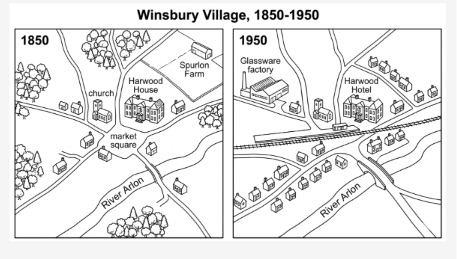
Band 8+: The maps below show the changes that have taken place in Winsbury Village between 1850 and 1950. Summarise the information by selecting and reporting the main features, and make comparisons where relevant.

Image for topic: The maps below show the changes that have taken place in Winsbury Village between 1850 and 1950. Summarise the information by selecting and reporting the main features, and make comparisons where relevant.
Our system will evaluate the answer based on this AI-generated description.
The image features two maps titled "Winsbury Village, 1850-1950", contrasting the village layout between "1850" and "1950". In the 1850 map, labeled features include "church" and "market square" at a central road junction, "Harwood House" to the east, "Spurlon Farm" to the northeast, and "River Arlon" running across the southern area, surrounded by wooded areas in the northwest, west, and south, along with a few scattered houses along the roads. In the 1950 map, labeled features include "Glassware factory" in the northwest, "Harwood Hotel" (occupying the former site of Harwood House), and "River Arlon" spanned by a bridge to the southeast. Additional developments in 1950 include an east-west railway line with a station near the central junction, new rows of residential houses replacing Spurlon Farm and line the roads to the south and northeast, while the church remains intact and the original trees and market square label are removed.
Given the complexity of the image, the above description may not be entirely accurate.
Note: Both the topic and the answer were created by one of our users.

The map compares how Winsbury Village changed over a century, from 1850 to 1950.

In general, the whole area underwent significant shifts including expansion, repurposing, additions and removals of several places, making the village evolve into a place with more accommodations, public facilities as well as convenient transportation.

In 1850, the northwestern area of Winsbury was mostly covered by trees, then a new glassware factory was introduced 100 years later, along with those green spaces being removed. While the local church still remained at the same place as the past, the Harwood House was repurposed as the only hotel in the village. Additionally, Spurlon Farm, where once located in the top-left corner of the map, made way for housing introduction in 1950.

In the centre of the village once situated a market square, however, it was demolished and replaced by a railway passing through Winsbury from the east to the west. There were also more houses built near the railroad, which markedly facilitated convenient accommodations for residents there. Furthermore, a bridge over Arlon River was expanded to make it easier for people to commute.

Word Count: 184

Answers On The Same Topic:

The maps below show the changes that have taken place in Winsbury Village between 1850 and 1950. Summarise the information by selecting and reporting the main features, and make comparisons where relevant.

The two plans illustrate how Winsbury Village has changed from the year of 1850 to 1950. Overall, the Winsbury Village undergone a substantial redevelopment with more buldings and services such as accommodations, new factory, solid bridge and railway. In the year of 1850, Winsbury Village had fewer houses, numerous green spaces, one big farm on […]

The maps below show the changes that have taken place in Winsbury Village between 1850 and 1950. Summarise the information by selecting and reporting the main features, and make comparisons where relevant.

The maps compare the layout of Winsbury Village in 1850 and 1950. Overall, it can be seen that the village underwent significant modernisation over the 100-year period. Several new facilities were introduced by 1950, including a glassware factory, a railway line and additional residential buildings. In addition, the woodland areas were reduced, while the market […]

The maps below show the changes that have taken place in Winsbury Village between 1850 and 1950. Summarise the information by selecting and reporting the main features, and make comparisons where relevant.

The two maps compare the current layout the winsbury village from 1850 to 1950 . Overall, it can be seen that the village underwent significant modernisation. Several new facilities had added in 1950, including glassware factory, roads, and accommodation. In addition, the existing number of trees would be replaced by the glassware factory, market square […]

The maps below show the changes that have taken place in Winsbury Village between 1850 and 1950. Summarise the information by selecting and reporting the main features, and make comparisons where relevant.

The maps illustrate the information about the changes that have taken place in winsbury town in 1850 to 1950. Overall, there has many prominent changes in winsbury village in 1850 to 1950. Which are many trees to replace by glassware factory . After that, the winsbury village main market square supersede by railway line. In […]

See All

Other Topics:

The maps shows how Kingsley changed from 1950 to now.

The map demonstrates how a town has developed since 1950 to a present day. Overall, one of the biggest changes, which we can see, was to the north of the river. Firstly, to the left of the road today housing estate has been built and opposite this place two buildings have been made by people, […]

The maps below show the town of Redbridge in 1995 and today. Summarise the information by selecting and reporting the main features, and make comparisons where relevant.

The maps illustrate the changes that have taken place in the town of Redbridge between 1995 and the present day. Overall, Redbridge has undergone significant development, particularly in terms of residential and commercial facilities. The most notable change is that the large area of farmland in the southern part of the town has been replaced […]

The two maps show an island before and after the construction of some tourist facilities. Summarise the information by selectiong and reporting the main features, and make comparisons where releevant.

The given diagrams depict an island before and after the refurbishment of a few tourist infrastructure. Overall, the majority of the modernizations were constructed in western two thirds of the island with some tourism amenities, while the eastern part remains in its natural state. Prior to the development, the island was inhabited with several natural […]

The two maps show an island before and after the construction of some tourist facilities. Summarise the information by selectiong and reporting the main features, and make comparisons where releevant.

The given diagrams depict an island before and after the refurbishment of a few tourist infrastructure. Overall, the majority of the modernizations was constructed in western two third of the island with some tourism amenities, while the eastern part remains in its natural state. Prior to the development, the island was unhabited with several natural […]

The diagrams below show changes in Felixstone in the UK between 1967 and 2001.

The two maps illustrate how the Felixstone city took place changes over a thirty four-year period from 1967 to 2001. Overall, the Felixstone city significantly developed from a large farmland to a full set of vocation such as a swimming pool, hotel, and two tennis courts. In thirty-four years ago, the city substantially focused on […]

See All
We have detected unusual activity on your device.
Please verify your identity to continue.
Note: This verification step won't sign you in. If you have a premium account, please log in to access the service as usual.
Google/Gmail Verification
Or verify using Email/Code
We've sent a verification code to:
youremail@gmail.com (Not your email?)
Enter it below to complete the verification process.
Ensure your email address is correct, your inbox is not full, and you check your spam folder. If no email arrives, consider using an alternative email.
You will need a Premium plan to perform your action!
Note: If you already have a premium account, please log in to access our services as usual.

Plans & Pricing

Our mission is to make quality education accessible for everyone.
However, to keep our hardworking team running and this service alive, we genuinely need your support!
By opting for a premium plan, not only do you sustain us in achieving the mission, but you also unlock advanced features to enrich your learning experience.

Free

For learners who aren't pressed for time

What's included on Free
100+ Cambridge IELTS Tests
Instant IELTS Writing Task 1 & 2 Evaluation (2 times/month)
Instant IELTS Speaking Part 1, 2, & 3 Evaluation (2 times/month)
Instant IELTS Writing Task 1 & 2 Essay Generator (2 times/month)
500+ Dictation & Shadowing Exercises
100+ Pronunciation Exercises
Flashcards
Other Advanced Tools

Premium

For those serious about advancing their English proficiency, and for IELTS candidates aspiring to boost their band score by 1-2 points (especially in writing & speaking) in just 30 days or less

What's included on Premium
Save Your IELTS Test Progress & Analyze Mistakes By Question Type
Save Your Own Flashcard Sets & Use Them On Any Device
Unlock All Courses, IELTS Tests, Section & Part Practice
Unlimited AI Conversations
Unlimited AI Writing Enhancement Exercises
Unlimited IELTS Writing Task 1 & 2 Evaluation
Unlimited IELTS Speaking Part 1, 2, & 3 Evaluation
Checked Answers Will Not Be Published
Unlimited IELTS Writing Task 1 & 2 Essay Generator
Unlimited IELTS Speaking Part 1, 2, & 3 Sample Generator
Unlimited Usage Of Advanced Tools & AI Features
Priority Support within 24h (12-month plan only)

Due to the nature of our service and the provided free trials, payments are non-refundable.