🔥 Today Only: Save 30% on Premium — Offer Ends Soon! - Upgrade Now!
Table

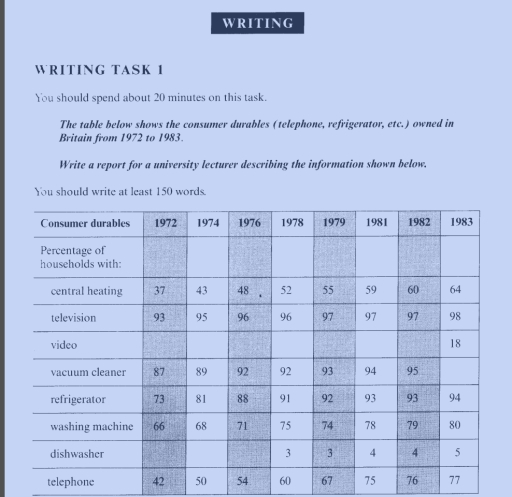
Band 4+: The table below shows the consumer durables (telephone, refrigerator, etc. owned in Britain from 1972 to 1983

Image for topic: The table below shows the consumer durables (telephone, refrigerator, etc. owned in Britain from 1972 to 1983
Our system will evaluate the answer based on this AI-generated description.
The image contains a table detailing the percentage of British households owning specific consumer durables from 1972 to 1983. Central heating ownership: 37% in 1972, 43% in 1974, 48% in 1976, 52% in 1978, 55% in 1979, 59% in 1981, 60% in 1982, 64% in 1983. Television ownership: 93% in 1972, 95% in 1974, 96% in 1976, 96% in 1978, 97% in 1979, 97% in 1981, 97% in 1982, 98% in 1983. Video ownership starts at 18% in 1983. Vacuum cleaner ownership: 87% in 1972, 89% in 1974, 92% in 1976, 92% in 1978, 93% in 1979, 94% in 1981, 95% in 1982 and 1983. Refrigerator ownership: 73% in 1972, 81% in 1974, 85% in 1976, 91% in 1978, 92% in 1979, 93% in 1981, and 94% in 1982 and 1983. Washing machine ownership: 66% in 1972, 68% in 1974, 71% in 1976, 75% in 1978, 74% in 1979, 78% in 1981, 79% in 1982, 80% in 1983. Dishwasher ownership: 3% in 1978, 3% in 1979 and 1981, 4% in 1982, 5% in 1983. Telephone ownership: 42% in 1972, 50% in 1974, 54% in 1976, 60% in 1978, 67% in 1979, 75% in 1981, 76% in 1982, 77% in 1983.
Given the complexity of the image, the above description may not be entirely accurate.
Note: Both the topic and the answer were created by one of our users.

The given table illustrate that the several home acessories those are consumed by the britian public between 1972 and 1983. The table demonstrate the data in tabular form with different percentage.

In the begining, the first thing that are included in durables is central heating whose proportion is exclate maximum 5% throughout the given years and started to 37%. The dishwasher use is started in 1983 and only 18% Similarly the videos are not in the usage from the starting it began in 1978 and not in a much value.

Additionally, the vaccum cleaner cosumption increased 3% with the passage of time and its used end at 1982 with the 95%. Telephone is the basic need it is started freom 42% and reached at 77 percent.

Finally, it can be seen that the television is in the higher ratio of consumption after that refrigrators and washing machines are good consumer at the end 94% and 80% respectivly.

Word Count: 157

Answers On The Same Topic:

The table below shows the consumer durables (telephone, refrigerator, etc. owned in Britain from 1972 to 1983

The provided table elucidate the consumer durable owning in United Kingdom between the years of 1972 to 1983. As an overall, it is noticeable here that deviation can be seen throughout the period. To commence, in the start four years of the given period fluctuation can be detected in the percentage of all households. However, […]

The table below shows the consumer durables (telephone, refrigerator, etc. owned in Britain from 1972 to 1983

The table illustrates the ownership of consumer durables such as central heating, television, video, etc. in Britain from 1972 to 1983. Overall, the ownership of consumer durables increased during this period. The biggest increases between the two years were in telephone and refrigerator ownership. Television was the most common in all the years. In 1972, […]

The table below shows the consumer durables (telephone, refrigerator, etc. owned in Britain from 1972 to 1983

The table chart compares the number of consumer durables ( Central heating, Television, Video, Vacuum cleaner, Refrigerator, Washing machine, Dishwasher, and Telephone) owned in Britain between 1972 to 19863. Overall, it is clear that Television number for the largest share of the Britain over the period, while Dishwasher accounted for the smallest share. Other categories […]

The table below shows the consumer durables (telephone, refrigerator, etc. owned in Britain from 1972 to 1983

The graph illustrates the percentage of households that owned various consumer durables from 1972 to 1983 in Britain. Overall, all the consumer durables increased steadily, although the extent of growth varied considerably. Televisions and vacuum cleaners were already widely owned by households in 1972, while central heating experienced the most substantial rise. By 1983, televisions, […]

The table below shows the consumer durables (telephone, refrigerator, etc. owned in Britain from 1972 to 1983

The table illuminates the rate of consuming different households equipment by Britain consumers Between 1972 and 1983. According to the table , Britain people owned central heating 37% in 1972 and it softly increased to 64% in the of year 1983. The Maximum household equipment was television in the mentioned years within Britain people started […]

See All

Other Topics:

The table presents how much people from five employment sectors earned, in three different salary levels in 2009. Summarise the information by selecting and reporting the main features, and make comparisons where relevant.

The given table chart illustrates information about income levels in 5 different sectors in 2009. Overall, the sector that showed the maximum salary was finance, whereas hospitality was the lowest maximum salary among all sectors. Despite the fact that the highest minimum salary became finance, construction had become the lowest minimum. The largest salary gap […]

The table below gives information about the key characteristics of visitors to New Zealand for the month of September in 2012 and 2016. Summarise the information by selecting and reporting the main features, and make comparisons where relevant.

The table compares the main characteristics of people who visited New Zealand in September 2012 and September 2016, including their total number, travel purposes and age groups. Overall, the total number of visitors increased considerably over the four-year period. Holidays remained the most common reason for travelling, while education and attending conferences were the least […]

The table below shows the figures for different products sold in a store between 2010 and 2020.

The table illustrates and compares figures for different gadgets sold by a store between 2010 and 2020. Overall, all the products saw gradual rising in sales as years went on except cameras that became less and less sold every year. Laptops always remained the most sold item in the shop, In contrast cameras made the […]

The table below shows the results of a survey carried out with visitors to the London Natural History Museum. Summarize the information by selecting and reporting the main features, and make comparisons where relevant.

Nowadays museums and history play a specific part in our lives. One of the greatest and divirsificated museum is the London Natural History Museum. Many people come to visit it every year for different needs. In this essay we will see and disscus from different points of vision this topic To begin with, the London […]

The given table shows the number of international visitors arriving to nine different countries and the percentage changes between 2009 and 2010.

The table below illustrates the detailed information about the flow of tourists in eight diifrent countries from 2009 to 2010, in millions and changes in percantages. Overall, it is clear that the in every country the percentage of tourist arivals have risen especially in Germany. On the other hand, in Hong kong they went down […]

The table below gives information about the key characteristics of visitors to New Zealand for the month of September in 2012 and 2016. Summarise the information by selecting and reporting the main features, and make comparisons where relevant.

The table compares the main characteristics of people who visited New Zealand in September 2012 and September 2016, including their total number, travel purposes and age groups. Overall, the total number of visitors increased considerably over the four-year period. Holidays remained the most common reason for travelling, while education and attending conferences were the least […]

See All
We have detected unusual activity on your device.
Please verify your identity to continue.
Note: This verification step won't sign you in. If you have a premium account, please log in to access the service as usual.
Google/Gmail Verification
Or verify using Email/Code
We've sent a verification code to:
youremail@gmail.com (Not your email?)
Enter it below to complete the verification process.
Ensure your email address is correct, your inbox is not full, and you check your spam folder. If no email arrives, consider using an alternative email.
You will need a Premium plan to perform your action!
Note: If you already have a premium account, please log in to access our services as usual.

Plans & Pricing

Our mission is to make quality education accessible for everyone.
However, to keep our hardworking team running and this service alive, we genuinely need your support!
By opting for a premium plan, not only do you sustain us in achieving the mission, but you also unlock advanced features to enrich your learning experience.

Free

For learners who aren't pressed for time

What's included on Free
100+ Cambridge IELTS Tests
Instant IELTS Writing Task 1 & 2 Evaluation (2 times/month)
Instant IELTS Speaking Part 1, 2, & 3 Evaluation (2 times/month)
Instant IELTS Writing Task 1 & 2 Essay Generator (2 times/month)
500+ Dictation & Shadowing Exercises
100+ Pronunciation Exercises
Flashcards
Other Advanced Tools

Premium

For those serious about advancing their English proficiency, and for IELTS candidates aspiring to boost their band score by 1-2 points (especially in writing & speaking) in just 30 days or less

What's included on Premium
Save Your IELTS Test Progress & Analyze Mistakes By Question Type
Save Your Own Flashcard Sets & Use Them On Any Device
Unlock All Courses, IELTS Tests, Section & Part Practice
Unlimited AI Conversations
Unlimited AI Writing Enhancement Exercises
Unlimited IELTS Writing Task 1 & 2 Evaluation
Unlimited IELTS Speaking Part 1, 2, & 3 Evaluation
Checked Answers Will Not Be Published
Unlimited IELTS Writing Task 1 & 2 Essay Generator
Unlimited IELTS Speaking Part 1, 2, & 3 Sample Generator
Unlimited Usage Of Advanced Tools & AI Features
Priority Support within 24h (12-month plan only)

Due to the nature of our service and the provided free trials, payments are non-refundable.
Nếu bạn là người Việt Nam và không có hoặc không muốn trả bằng credit/debit cards, bạn có thể thanh toán bằng phương thức chuyển khoản:


Chọn gói:
419,000₫ 277,000 ₫ cho gói 1 tháng (chỉ 9,233₫/ngày)
1,239,000₫ 597,000 ₫ cho gói 3 tháng (chỉ 6,633₫/ngày)
2,469,000₫ 1,027,000 ₫ cho gói 6 tháng (chỉ 5,706₫/ngày)
4,929,000₫ 1,417,000 ₫ cho gói 12 tháng (chỉ 3,936₫/ngày)


Sau khi chuyển khoản, vui lòng đợi trình duyệt tự động điều hướng bạn trở lại Engnovate và bạn sẽ ngay lập tức nhận được mã kích hoạt tài khoản premium.
Nếu có lỗi xảy ra, bạn có thể liên hệ với team thông qua một trong các phương thức: email đến helloengnovate@gmail.com hoặc nhắn tin qua facebook.com/engnovate.
Vì toàn bộ công cụ trên website đều có thể sử dụng thử miễn phí, Engnovate không hỗ trợ hoàn tiền.