Our system will evaluate the answer based on this AI-generated description.
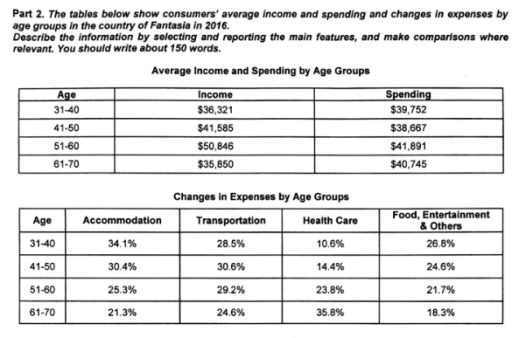
The image includes two tables: the first showing average income and spending by age groups, and the second showing changes in expenses by age groups. The first table reports income and spending: ages 31-40 ($36,321 income, $39,752 spending), ages 41-50 ($41,585 income, $38,667 spending), ages 51-60 ($50,846 income, $41,891 spending), and ages 61-70 ($35,850 income, $40,745 spending). The second table shows changes in expenses: ages 31-40 - Accommodation (34.1%), Transportation (28.5%), Health Care (10.6%), Food, Entertainment & Others (26.8%); ages 41-50 - Accommodation (30.4%), Transportation (30.6%), Health Care (14.4%), Food, Entertainment & Others (24.6%); ages 51-60 - Accommodation (25.3%), Transportation (29.2%), Health Care (23.8%), Food, Entertainment & Others (21.7%); ages 61-70 - Accommodation (21.3%), Transportation (24.6%), Health Care (35.8%), Food, Entertainment & Others (18.3%).
Given the complexity of the image, the above description may not be entirely accurate.
Skyrocket your IELTS band score by 1-2 points in under a month with our premium plan!
Note: Both the topic and the answer were created by one of our users.
The two tables provided illustrate the total amount of money and the changes in expenses by age groups in the country of Fantasia for the year 2016.
Overall, the age group of 51-60 represents the highest total amount of income and spending. In contrast, the income for the 31-40 and 61-70 age groups is notably low, with both groups having similar amounts of spending.
Looking at the changes in expenses across categories such as accommodation, transportation, healthcare, and food entertainment, it is evident that the 31-40 age group has a higher percentage for both accommodation and food entertainment, at 34.1% and 26.8% respectively, compared to other age groups. Meanwhile, the 41-50 age group shows the highest percentage for transportation at 30.6%, surpassing the other groups which stand at 30.4%, 14.4%, and 24.6%. Additionally, the 61-70 age group demonstrates a significantly higher percentage of healthcare expenses at 35.8%, compared to 21.3%, 24.6%, and 18.3% for the other groups.
Both the 31-40 and 61-70 age groups exhibit higher spending compared to their income, which has a considerable impact on their overall expenses.
Word Count: 180