Our system will evaluate the answer based on this AI-generated description.
The image shows a line graph detailing projected job openings (in thousands) from 2021 to 2026 across six job categories: Data Scientist, Software Engineer, Graphic Designer, Accountant, Marketing Manager, and HR Specialist. In 2021, Data Scientist has 30, Software Engineer 80, Graphic Designer 25, Accountant 70, Marketing Manager 40, HR Specialist 50. In 2022, Data Scientist 40, Software Engineer 85, Graphic Designer 30, Accountant 65, Marketing Manager 42, HR Specialist 48. In 2023, Data Scientist 50, Software Engineer 90, Graphic Designer 35, Accountant 60, Marketing Manager 44, HR Specialist 46. In 2024, Data Scientist 60, Software Engineer 85, Graphic Designer 35, Accountant 55, Marketing Manager 46, HR Specialist 44. In 2025, Data Scientist 75, Software Engineer 80, Graphic Designer 40, Accountant 50, Marketing Manager 48, HR Specialist 42. In 2026, Data Scientist 90, Software Engineer 78, Graphic Designer 45, Accountant 45, Marketing Manager 50, HR Specialist 40.
Given the complexity of the image, the above description may not be entirely accurate.
Skyrocket your IELTS band score by 1-2 points in under a month with our premium plan!
Note: Both the topic and the answer were created by one of our users.
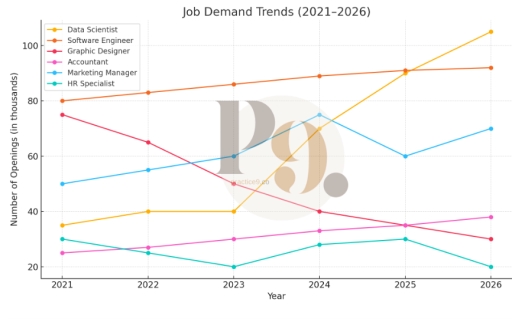
The line graph illustrates the number of works discovering in six different occupations during 5 year, starting from 2021.
Overall, Data Scientist show significant increased and will reach the highest point, while HR Specialist remain stable during the period and will culminate at the lowest point.
Data Scientist, Software Engineer, and Accountant numbers of openings rose gradually, from 2021 to 2023 they grow only for above 5 thousand. Whereas, Accountant and Data Scientist numbers continued increasing steady, Data Scientist jump sharply and hit the same point, roughly 90 thousand with Software Engineering in 2025. Then all three occupations will expect an increase at the same pace, as it was.
In the first two years HR Specialist and Graphic Designer has experienced decrease and reache approximately 50 and 20 thousands, respectively. HR specialist changed intermittently and will rebound to the same position in 3 years, while Graphic Designer will ended up the same point where HR Specialsit was starting. And the remaining graph experienced slight increase and then fluctuated during all period, and will reach a little higher than 70 thousand.
Word Count: 180