Our system will evaluate the answer based on this AI-generated description.
The image shows two graphs: the first graph depicts monthly figures for "Weight of fruit produced (tonnes) in 2013" and "Amount of fertiliser used (tonnes) in 2013"; the monthly weight of fruits starts at 1.5 tonnes in January, slightly rises to 1.6 in February, steadily increases to 2.0 in March, reaches 2.7 in April, sharply climbs to 3.2 in May, peaks at 4.0 in June, then decreases to 3.8 in July, continues descending to 3.0 in August, drops to 2.0 in September, further declines to 1.0 in October, and stabilizes at 0.9 tonnes in November and December; the monthly amount of fertiliser remains constant at 0.3 tonnes from January to April, surges to 1.3 in May, falls to 0.8 in June, drops to 0.5 in July, decreases to 0.3 in August and September, and slightly rises back to 0.5 tonnes in October before steadying at 0.4 in November and December; the second graph shows monthly "Rainfall in millimeters in 2013" with January at 13 mm, February at 17, March at 12, April at 8, May at 4, June at 3, July at 2, August at 3, September at 4, October at 7, November at 12, and December at 14.
Given the complexity of the image, the above description may not be entirely accurate.
Skyrocket your IELTS band score by 1-2 points in under a month with our premium plan!
Note: Both the topic and the answer were created by one of our users.
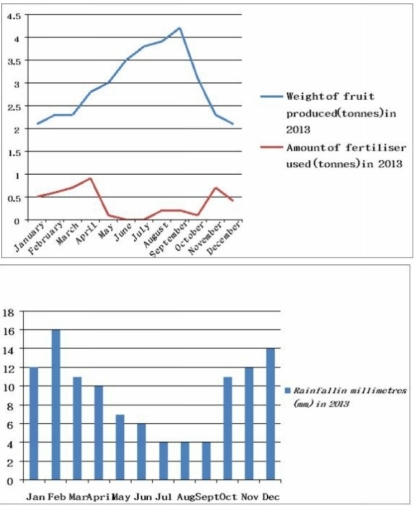
The first line graph illustrates weight of fruit that were cultivated and the amount of fertilizer that were used for it in terms of the months in 2013. Additionally, the bar graph comapares the months of the year mentioned in terms of volume of the rainfall.
Overall, the production of fruit trend was mostly reversed from the other two figures. With a rough estimation, similar to usage of fertiliser whenever the figure of rainfall volume was increasing the fruit production declined.
Regarding the weight of fruit production and fertiliser usage, the fruit weight figure began at a low of nearly 2 tonnes with 0.5 tonnes of fertiliser used for it. Similarly, both figures experienced a gradual increment. Before reaching to a peak of more than 4 tonnes of fruit in Agust, the fertiliser witnessed a peak in the middle of March. However, fruit production declined a tremendous amount after the peak, fertiliser usage had some slight fluctuations and even experienced another peak of more the 0.5 tonnes in November.
By contrast, before the surge of 16 mm of rainfall in February, the volume of rainfall was at 12 mm in January. While the usage of fertilizer were fluctuating dramatically between February and June, rainfall volume figure decreased substantially. In the last three month of 2013, similar to the production of fruit, the volume of rainfall had a steady trend.
Word Count: 229
