Our system will evaluate the answer based on this AI-generated description.
The image depicts a bar graph illustrating global sales in billions of dollars for digital games from 2000 to 2006, broken down by game types: mobile phone, online, console, and handheld. In 2000, console games were at $6 billion, handheld games at $11 billion, with mobile and online games at $0. In 2001, console games hit $5 billion, handheld games reached $12 billion, with no sales for mobile and online games. In 2002, console games were at $6 billion, handheld at $13 billion, online games started at $1 billion, and mobile games at $0.1 billion. In 2003, console games reached $5 billion, handheld $14 billion, online games $1.5 billion, and mobile phone games $0.4 billion. In 2004, console games rose to $7 billion, handheld maintained $14 billion, online games reached $3.5 billion, and mobile games $1 billion. In 2005, console games were $8 billion, handheld $15 billion, online games $6 billion, and mobile phone games $4 billion. In 2006, console games reached $10 billion, handheld games $18 billion, online games $9 billion, and mobile games $7 billion.
Given the complexity of the image, the above description may not be entirely accurate.
Skyrocket your IELTS band score by 1-2 points in under a month with our premium plan!
Note: Both the topic and the answer were created by one of our users.
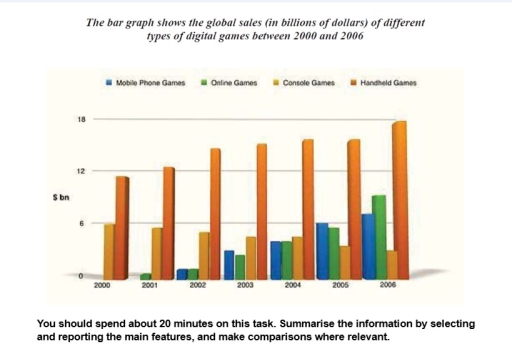
The chart below illustrates the expenditure on several type of internet games from 2000 to 2006. The units are measured in billions of dollars.
Overall, handheld games managed to keep its place as the most sailed type of games through the given period. As for the online and mobile phone games, their popularity among gamers is growing each year. In contrast, console games are the only category to had lost its popularity by 2006.
The demand for handheld games never reduced, demostrating the highest rate and continiued to grow, so beginning from inder 12 billion dollars it reached 18 dollars at 2006. On the other hand, console games, that was at half of handled games and the second category to be saled, it gradually lost popularity though the selected amount of time, finishing to be the least required game (approximately 3 billion dollars).
Meanwhile, mobile phone games and online games show a slow but stable growth, for online games starting its journey as a new type of game from 2001 and for mobile phone games from 2002. As a result, both culminated at above six million dollars, reaching approximately seven and nine billion dollars, respectively.
Word Count: 195