Our system will evaluate the answer based on this AI-generated description.
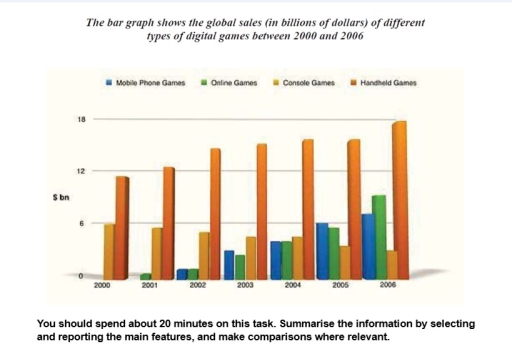
The image depicts a bar graph illustrating global sales in billions of dollars for digital games from 2000 to 2006, broken down by game types: mobile phone, online, console, and handheld. In 2000, console games were at $6 billion, handheld games at $11 billion, with mobile and online games at $0. In 2001, console games hit $5 billion, handheld games reached $12 billion, with no sales for mobile and online games. In 2002, console games were at $6 billion, handheld at $13 billion, online games started at $1 billion, and mobile games at $0.1 billion. In 2003, console games reached $5 billion, handheld $14 billion, online games $1.5 billion, and mobile phone games $0.4 billion. In 2004, console games rose to $7 billion, handheld maintained $14 billion, online games reached $3.5 billion, and mobile games $1 billion. In 2005, console games were $8 billion, handheld $15 billion, online games $6 billion, and mobile phone games $4 billion. In 2006, console games reached $10 billion, handheld games $18 billion, online games $9 billion, and mobile games $7 billion.
Given the complexity of the image, the above description may not be entirely accurate.
Skyrocket your IELTS band score by 1-2 points in under a month with our premium plan!
Note: Both the topic and the answer were created by one of our users.
The chart provides information on the sales of various types of digital games around the world over a period of 6 years from 2002 to 2006.
In general, it can be clearly seen from the chart that handheld games were at top sales each year and they illustrated a steady increase from 2000 to 2006. Meanwhile, online, mobile phone games were the least popular sales through each year but both of them indicated a gradual rise in the sales from 2001 to 2006. Console games were at a moderate position in the sales of digital games.
To begin with, mobile phone games remained the lowest sales each year and they increased gradually from 2 dollars bn in 2002 to 7 dollars in 2006. While console games witnessed a steady decrease from 6 dollars in 2000 to 3 dollars in 2006.
In addition to this, the number of sales in handheld games were predominantly high in 2000 with approximately 12 dollars and they showed a dramatic increase in the figure of sales from 12 dollars in 2000 to 18 dollars in 2006. In contrast, online games were the lowest figure with approximately 1 dollars but they illustrated a significant rise from 2001 to 2006, 1 dollars and 8 dollar, respectively.
Word Count: 209
