Our system will evaluate the answer based on this AI-generated description.
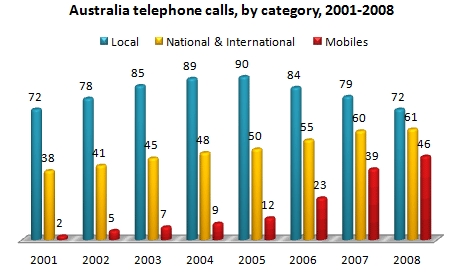
The image contains a bar graph titled "Australia telephone calls, by category, 2001-2008," displaying three categories: Local, National & International, and Mobiles. In 2001, Local had 72 units, National & International had 38 units, and Mobiles had 2 units. In 2002, Local had 78 units, National & International had 41 units, and Mobiles had 5 units. In 2003, Local had 85 units, National & International had 45 units, and Mobiles had 7 units. In 2004, Local had 89 units, National & International had 48 units, and Mobiles had 9 units. In 2005, Local had 90 units, National & International had 50 units, and Mobiles had 12 units. In 2006, Local had 84 units, National & International had 55 units, and Mobiles had 23 units. In 2007, Local had 79 units, National & International had 50 units, and Mobiles had 39 units. In 2008, Local had 72 units, National & International had 46 units, and Mobiles had 51 units.
Given the complexity of the image, the above description may not be entirely accurate.
Skyrocket your IELTS band score by 1-2 points in under a month with our premium plan!
Note: Both the topic and the answer were created by one of our users.
The bar chart shows information about total telephone calls in a minute that have been made between 2001 to 2008 in Australia. Overall, it can be clearly seen that the local calls are majority method of calling, while mobiles calls was the lowest in 2001.
To begin with, local calls observed an increase till 2005, where it dropped to 72 billion calls at the end of the period. On the other hand, between 2001 to 2008 it detects slowly climb reaching 61 billion calls. Meanwhile, it is clearly seen there is sharply rise for mobiles calls reaches 46 billion call.
In conclusion, it is obvious that the most popular type of calls is local telephone call where it is used more than the other methods over the period.
Word Count: 128
