Our system will evaluate the answer based on this AI-generated description.
The image displays a bar chart titled "UK telephone calls, by category, 1995-2002" with the x-axis representing years from 1995 to 2002 and the y-axis indicating percentage from 0 to 100%. The chart is divided into three categories of call types: Local - fixed line, National and international - fixed line, and Mobiles (all calls). Each year from 1995 to 2002 shows a sequential decline in the percentage of Local - fixed line calls, starting at roughly 61% in 1995 and decreasing to about 36% in 2002. National and international - fixed line calls remained fairly consistent throughout the period, starting at approximately 38% in 1995 and fluctuating slightly to around 37% in 2002. Mobile calls (all calls) show an increase from about 1% in 1995 to roughly 27% in 2002. Each year is represented by three bars corresponding to each category, placed side by side for comparative analysis.
Given the complexity of the image, the above description may not be entirely accurate.
Skyrocket your IELTS band score by 1-2 points in under a month with our premium plan!
Note: Both the topic and the answer were created by one of our users.
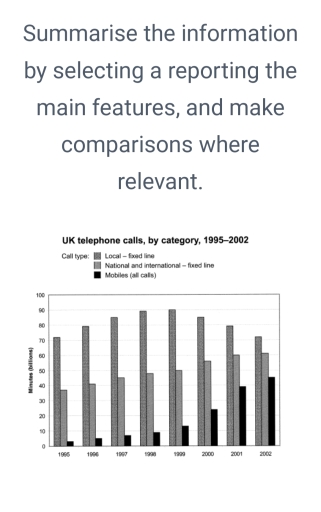
The bar chart illustrates the total number of minutes (in billions) of telephone calls UK people made with three categories (local, national and international, and mobile) during 1995 to 2002.
On 1995, the local call started the chart with about 72 billions minutes and continued to rise until reached the highest peak on 1999 with 90 billions minutes. However, it gradually decline on 2000 till 2002 landed with the same figure as 1995. Moving on to national and international fixed line call, it kept increasing from 1995 with around 38 billions minutes to 2002 with 62 billions minutes of calls as the highest number. Lastly, the mobile calls began the chart with the lowest number compared to other two categories at around 4 billions minutes. This is reasonable for that period as mobile telephone had not been developed well, but from year of 2000 to 2002, the total number of mobile calls showed a significant increase to approximately 56 billions minutes.
Overall, UK society favors to call more locally followed by national-international and mobile calls. Moreover, the rise of mobile calls number highlights the development of communication devices adding to its variety.
Word Count: 192
