Our system will evaluate the answer based on this AI-generated description.
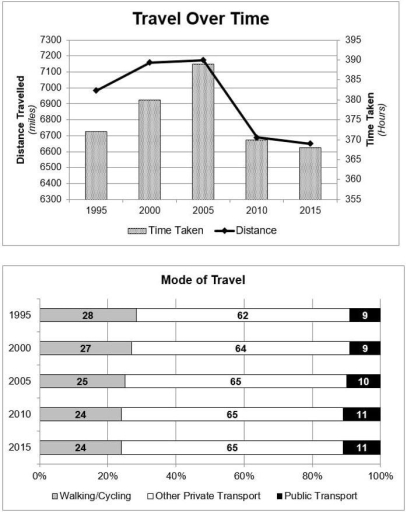
The image shows a bar and line graph titled "Travel Over Time" with distance traveled in miles and time taken in hours from 1995 to 2015. The graph shows distance traveled: 6700 (1995), 7100 (2000), 7200 (2005), 6800 (2010), 6600 (2015) and time taken (hours): 375 (1995), 385 (2000), 390 (2005), 380 (2010), 375 (2015). The second section is a bar chart depicting "Mode of Travel" with walking/cycling, other private transport, and public transport percentages for each year. For 1995: 28% walking/cycling, 62% other private transport, 9% public transport. For 2000: 27% walking/cycling, 64% other private transport, 9% public transport. For 2005: 25% walking/cycling, 65% other private transport, 10% public transport. For 2010: 24% walking/cycling, 65% other private transport, 11% public transport. For 2015: 24% walking/cycling, 65% other private transport, 11% public transport.
Given the complexity of the image, the above description may not be entirely accurate.
Skyrocket your IELTS band score by 1-2 points in under a month with our premium plan!
Note: Both the topic and the answer were created by one of our users.
The chart illustrates the travelling of people from one country . overall the highest distance travel is from 7100 km in 2005 at 390 hour . and the lowest is the 6600 in 2015 at370 hour.
The distance travelled in 1995 was 6700 . and it increased to 6900 after 5 years in 2000. it reached the highest to 7100 in 2005. and it decreases to 6600 in 2010.and then6700 inercentage for 2015.in the second table it depits about the mode of transport in one country .in 1995 , the percentage for walking / cycling was 28%.moreover the percentage for other private transport was the highest with 62% and public transport was about 9%.,
in 2000, the highest was for other private transport with 64% and depicting same for public transport with 9%. in 2005, other private transport was 65% and 10% for public transport.in 2010 the walking / cycling people were 24% and remaining the same as 65% for other private transport .11% for public transport in 2010.in 2015, it was the same for all modes of transport as previous year.
Word Count: 182
