Our system will evaluate the answer based on this AI-generated description.
The image is a line chart showing social media use among 30-45-year-olds in New Zealand. Four platforms are displayed, Facebook, Pinterest, Twitter, and LinkedIn, with the following percentage usage by month: January - Facebook 45%, Pinterest 25%, Twitter 15%, LinkedIn 10%; February - Facebook 43%, Pinterest 26%, Twitter 15%, LinkedIn 12%; March - Facebook 42%, Pinterest 25%, Twitter 15%, LinkedIn 13%; April - Facebook 40%, Pinterest 24%, Twitter 16%, LinkedIn 13%; May - Facebook 38%, Pinterest 23%, Twitter 17%, LinkedIn 12%; June - Facebook 37%, Pinterest 22%, Twitter 18%, LinkedIn 12%; July - Facebook 35%, Pinterest 22%, Twitter 19%, LinkedIn 12%; August - Facebook 33%, Pinterest 21%, Twitter 20%, LinkedIn 12%; September - Facebook 32%, Pinterest 21%, Twitter 19%, LinkedIn 13%; October - Facebook 33%, Pinterest 22%, Twitter 18%, LinkedIn 14%; November - Facebook 34%, Pinterest 23%, Twitter 17%, LinkedIn 13%; December - Facebook 36%, Pinterest 24%, Twitter 16%, LinkedIn 12%. Facebook has the highest usage every month, decreasing from January to August and increasing afterward, while LinkedIn has the lowest usage, moderately increasing from January to October and slightly decreasing toward December. Twitter and Pinterest usage fluctuate with a slight overall decrease for Pinterest and increase for Twitter.
Given the complexity of the image, the above description may not be entirely accurate.
Skyrocket your IELTS band score by 1-2 points in under a month with our premium plan!
Note: Both the topic and the answer were created by one of our users.
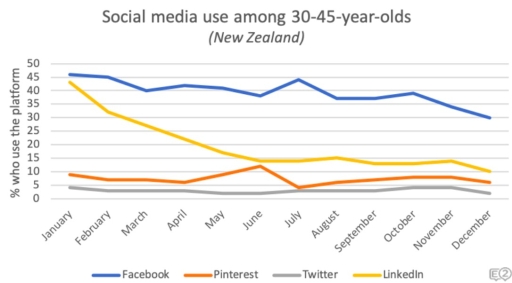
The given graph illustrates digital interaction in people communities 30-45 year-olds in New Zealand in the period of 2018.
Firstly, at the bedinning of the year in New Zealend , Facebook was leading in popularity ,showing the over 45 percentages, among other social medias, such as, Pinterest, Twitter, Linkedin. Secondly the gragh depicts thet the period from january to april was in terms of quite stable for majority of social apps. However the Twitter’s number of uses demonstrates the severe decline , while the Pinterest’s indicators reached their peak and succesfully were able to be align with Linkedin. Thirdly, since the month june, the line gragh indicates slight fluctations in the number of users. Facebook had a rough increase from june to july, but suddenly right after were found a downsize. Furthermore, the quentity of use indicators by Pinterest reflects the significant fall in one month from june to july, afterwards the measures were raising in moderation.
Overall, based on the given line graph, there were not any considerable increases in social media uses during the year, except uses of Pinterest.
Word Count: 181