Our system will evaluate the answer based on this AI-generated description.
The image contains a line graph titled "The number of XYZ radio station listeners since 1940 with projections until 2030" with a y-axis in "Thousands" and an x-axis showing years. The data points for (year, thousands of listeners) are approximately: (1940, 22), (1950, 55), (~1956, 105), (1960, 20), (~1965, 45), (1970, 45), (~1978, 45), (1980, 15), (~1984, 32), (1990, 22), (~1995, 33), (2000, 20), (2010, 23), (2020, 50), (~2028, 80), and (2030, 80). Also shown are two numbered lists: 1. mild fluctuations, 2. a peak, 3. a period of instability, 4. a significant increase, 5. a partial growth, 6. a record high, 7. figures climbing back, and 8. a marked rise, 9. a dramatic decrease, 10. a period of slight volatility, 11. a leveling out, 12. a sharp decline, 13. a plateau, 14. figures remaining constant. An example text related to numbers 1 and 5 states that from 1980 to 2000, the number of listeners ranged between 11 and 35, and a subsequent partial growth reached almost 25 thousand people.
Given the complexity of the image, the above description may not be entirely accurate.
Skyrocket your IELTS band score by 1-2 points in under a month with our premium plan!
Note: Both the topic and the answer were created by one of our users.
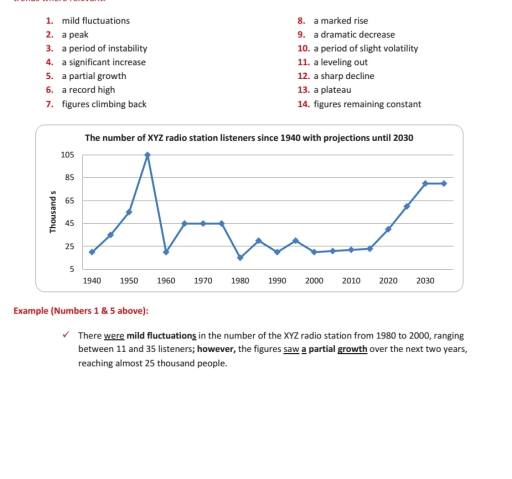
The line graph illustrates the changes in the number of listeners for the XYZ radio station between 1940 and 2024, with projected figures leading up to 2030.
Overall, the listener count has experienced a period of instability over the decades. While the station saw a significant peak in the mid-1950s followed by a sharp decline, it is predicted to recover and reach a plateau by the end of the decade.
In the early years, the number of listeners started at 20,000 in 1940 and saw a significant increase, reaching a record high of 105,000 in 1955. However, this was followed by a dramatic decrease over the next five years, with figures plummeting to roughly 20,000 by 1960. Between 1965 and 1975, the data showed a leveling out at 45,000, before another dip in 1980.
From 1980 to 2000, there were mild fluctuations where the figures hovered between 15,000 and 30,000. After 2010, the trend changed as figures began climbing back. By 2020, the number had risen to 40,000.
Looking at the future projections, a marked rise is expected to occur over the current decade. The figure is forecast to hit 80,000 by 2030. After this growth, the number of listeners is likely to remain constant at that level through to the end of the period.
Word Count: 215
