Our system will evaluate the answer based on this AI-generated description.
The image details UK total, Households, Businesses, and Government spending (in billions) from 2000-2010: 2000-Total: 5000, Households: 3000, Businesses: 1500, Government using no bar axis, 2001-Total: 5500, Households: 3000, Businesses: 2000, Government using no bar axis, 2002-Total: 6000, Households: 3500, Businesses: 2000, Government using no bar axis, 2003-Total: 6250, Households: 3500, Businesses: 2000, Government using no bar axis, 2004-Total: 6500, Households: 4000, Businesses: 2000, Government using no bar axis, 2005-Total: 6750, Households: 4000, Businesses: 2500, Government: slight gray, 2006-Total: 7000, Households: 4500, Businesses: 2500, Government using no bar axis, 2007-Total: 7000, Households: 4500, Businesses: 2500, Government using no bar axis, 2008-Total: 7250, Households: 4500, Businesses: 2500, Government using no bar axis, 2009-Total: 7000, Households: 4800, Businesses: 2000, Government: slight gray, 2010-Total: 7250, Households: 4800, Businesses: 2300, Government using no bar axis.
Given the complexity of the image, the above description may not be entirely accurate.
Skyrocket your IELTS band score by 1-2 points in under a month with our premium plan!
Note: Both the topic and the answer were created by one of our users.
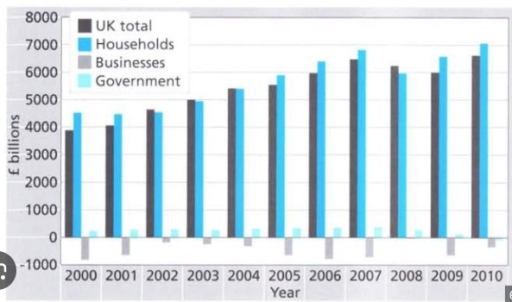
The bar graph shows the net worth among three different categories in the United Kingdom from 2000 to 2010.
Overall, the United Kingdom’s and households’ experienced a steady increase, although faced a minor decline. However, the other sector showed a few dramatic fluctuations.
The United Kingdom experienced a slight improvement from about 3900 billion in 2000 to 6500 billion by 2007. However, the trend slightly decreased approximately by 500 billion in the next two years before reaching more than 6500 billion.
Whereas, the household sector remained stable in the first three years at around 5400 billion. In addition, it improved steadily, accounting for more than 6000 billion in 2007. While this sector fell off by 500 billion in the next years, it gradually rose to its peak of 7000 billion.
On the other hand, the business sector faced a fluctuating loss for 10 years. It reached their biggest between 2000 and 2006, reaching negative 1000 billion. The government sector showed a similar figure at about 100 billion until 2009.
Word Count: 169
