Our system will evaluate the answer based on this AI-generated description.
The image details UK total, Households, Businesses, and Government spending (in billions) from 2000-2010: 2000-Total: 5000, Households: 3000, Businesses: 1500, Government using no bar axis, 2001-Total: 5500, Households: 3000, Businesses: 2000, Government using no bar axis, 2002-Total: 6000, Households: 3500, Businesses: 2000, Government using no bar axis, 2003-Total: 6250, Households: 3500, Businesses: 2000, Government using no bar axis, 2004-Total: 6500, Households: 4000, Businesses: 2000, Government using no bar axis, 2005-Total: 6750, Households: 4000, Businesses: 2500, Government: slight gray, 2006-Total: 7000, Households: 4500, Businesses: 2500, Government using no bar axis, 2007-Total: 7000, Households: 4500, Businesses: 2500, Government using no bar axis, 2008-Total: 7250, Households: 4500, Businesses: 2500, Government using no bar axis, 2009-Total: 7000, Households: 4800, Businesses: 2000, Government: slight gray, 2010-Total: 7250, Households: 4800, Businesses: 2300, Government using no bar axis.
Given the complexity of the image, the above description may not be entirely accurate.
Skyrocket your IELTS band score by 1-2 points in under a month with our premium plan!
Note: Both the topic and the answer were created by one of our users.
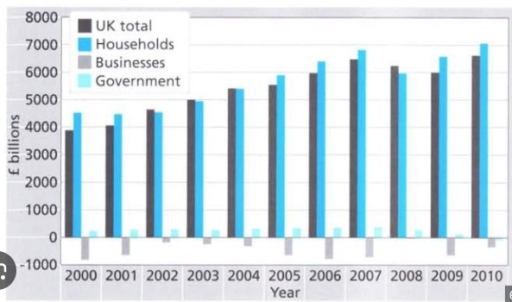
The chart illustrates the total income of the UK from its households, businesses and government from 2000 to 2010.
Overall, there has been a significant rise in the UK households yet it did fall in between the time period . The government also showed a positive growth but fell into negative figures in the following years. The wealth from UK businesses showed little improvement but experienced decline. The UK households contribute more to the society than UK businesses.
The figures of UK households remained steadily from 2000 to 2002 where it began to increase. By 2007, the UK household wealth went from 4500 billion pounds to 7000 billion pounds. The net worth of UK showed a similar pattern to that of UK household. Its income went from just below 4000 billion pounds to over 6000 billion pounds from 2000 to 2010, although both household and total showed decline in 2008 dropping to around 6000 billion pounds.
The net worth of Government showed improvement from 2000 to 2005, it started to get worse and fell into negative figures by 2010. Although the rest of the country showed continued growth from 2000 to 2007, the wealth in businesses declined. It showed an opposite trend to that of the rest of the country.
Word Count: 210
