Our system will evaluate the answer based on this AI-generated description.
The image details UK total, Households, Businesses, and Government spending (in billions) from 2000-2010: 2000-Total: 5000, Households: 3000, Businesses: 1500, Government using no bar axis, 2001-Total: 5500, Households: 3000, Businesses: 2000, Government using no bar axis, 2002-Total: 6000, Households: 3500, Businesses: 2000, Government using no bar axis, 2003-Total: 6250, Households: 3500, Businesses: 2000, Government using no bar axis, 2004-Total: 6500, Households: 4000, Businesses: 2000, Government using no bar axis, 2005-Total: 6750, Households: 4000, Businesses: 2500, Government: slight gray, 2006-Total: 7000, Households: 4500, Businesses: 2500, Government using no bar axis, 2007-Total: 7000, Households: 4500, Businesses: 2500, Government using no bar axis, 2008-Total: 7250, Households: 4500, Businesses: 2500, Government using no bar axis, 2009-Total: 7000, Households: 4800, Businesses: 2000, Government: slight gray, 2010-Total: 7250, Households: 4800, Businesses: 2300, Government using no bar axis.
Given the complexity of the image, the above description may not be entirely accurate.
Skyrocket your IELTS band score by 1-2 points in under a month with our premium plan!
Note: Both the topic and the answer were created by one of our users.
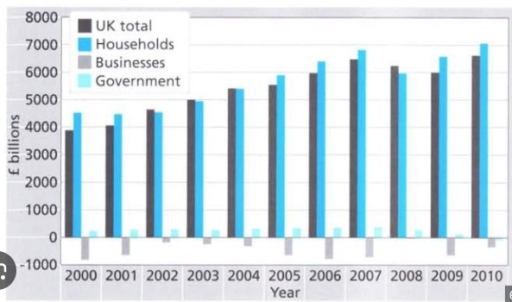
The bar chart represents a comparisons between the net worth of three different sectors in the UK from 2000 to 2010. Units are measured in billions pound.
Overall, it is clear from the graph that Households sector had the largest share among other sectors, while businesses sector did not show any profit, and the government sector remaind stable during the period.
According to what is shown, the households sector recorded a moderate increase during the period. At the beginning, it started at around 4500 billion pound, then it remaind steadly increasing untill 2008 when it saw a slightly decrease, from just under 7000 billion pound in 2007 to around 6000 billion pound in 2008. Then, it peaked at around 7000 billion pound in 2010.
In terms of the other sectors, the government sector remained constant approximatly from 2000 to 2008, then it started to decrease for the rest years. Meanwhile, busnisses sector did not achieve any profit, but also it experienced a considerable damages during the period.
Word Count: 167
