🔥 Today Only: Save 30% on Premium — Offer Ends Soon! - Upgrade Now!
Bar Chart

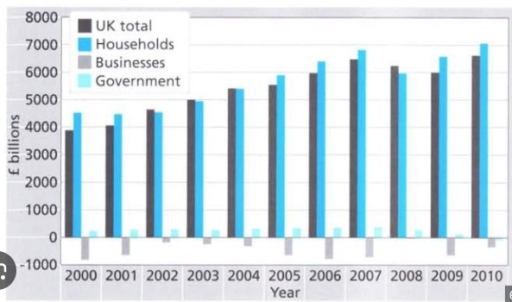
Band 6+: The provided bar graph compares the net worth across three different sectors in the UK between 2000 and 2010.

Image for topic: The provided bar graph compares the net worth across three different sectors in the UK between 2000 and 2010.
Our system will evaluate the answer based on this AI-generated description.
The image details UK total, Households, Businesses, and Government spending (in billions) from 2000-2010: 2000-Total: 5000, Households: 3000, Businesses: 1500, Government using no bar axis, 2001-Total: 5500, Households: 3000, Businesses: 2000, Government using no bar axis, 2002-Total: 6000, Households: 3500, Businesses: 2000, Government using no bar axis, 2003-Total: 6250, Households: 3500, Businesses: 2000, Government using no bar axis, 2004-Total: 6500, Households: 4000, Businesses: 2000, Government using no bar axis, 2005-Total: 6750, Households: 4000, Businesses: 2500, Government: slight gray, 2006-Total: 7000, Households: 4500, Businesses: 2500, Government using no bar axis, 2007-Total: 7000, Households: 4500, Businesses: 2500, Government using no bar axis, 2008-Total: 7250, Households: 4500, Businesses: 2500, Government using no bar axis, 2009-Total: 7000, Households: 4800, Businesses: 2000, Government: slight gray, 2010-Total: 7250, Households: 4800, Businesses: 2300, Government using no bar axis.
Given the complexity of the image, the above description may not be entirely accurate.
Note: Both the topic and the answer were created by one of our users.

The bar graph shows the net worth among three different categories in the United Kingdom from 2000 to 2010.

Overall, the United Kingdom’s and households’ experienced a steady increase, although faced a minor decline. However, the other sector showed a few dramatic fluctuations.

The United Kingdom experienced a slight improvement from about 3900 billion in 2000 to 6500 billion by 2007. However, the trend slightly decreased approximately by 500 billion in the next two years before reaching more than 6500 billion.

Whereas, the household sector remained stable in the first three years at around 5400 billion. In addition, it improved steadily, accounting for more than 6000 billion in 2007. While this sector fell off by 500 billion in the next years, it gradually rose to its peak of 7000 billion.

On the other hand, the business sector faced a fluctuating loss for 10 years. It reached their biggest between 2000 and 2006, reaching negative 1000 billion. The government sector showed a similar figure at about 100 billion until 2009.

Word Count: 169

Answers On The Same Topic:

The provided bar graph compares the net worth across three different sectors in the UK between 2000 and 2010.

The bar chart represents a comparisons between the net worth of three different sectors in the UK from 2000 to 2010. Units are measured in billions pound. Overall, it is clear from the graph that Households sector had the largest share among other sectors, while businesses sector did not show any profit, and the government […]

The provided bar graph compares the net worth across three different sectors in the UK between 2000 and 2010.

The chart illustrates the total income of the UK from its households, businesses and government from 2000 to 2010. Overall, there has been a significant rise in the UK households yet it did fall in between the time period . The government also showed a positive growth but fell into negative figures in the following […]

The provided bar graph compares the net worth across three different sectors in the UK between 2000 and 2010.

The graphs indicates information about net earnings of the UK over a 10 years period between 2000 and 2010 divided into three different sectors. Overall, looking at the details, the households always had the highest amount of wealth compared to the other result two groups. Meanwhile, the buisiness wealth was negative all the years. The […]

The provided bar graph compares the net worth across three different sectors in the UK between 2000 and 2010.

The bar chary represents the net worth of the different sectors of UK in period from 2000 and 2010. The overall net worth of UK, including all three sectors is showing pretty sharp incline from 2000 and 2007, growing for about 3000 billion pounds. In 2007 and 2010 timestamp fluctuations took a place, but at […]

See All

Other Topics:

the bar chart below shows information on employment rates across 6 countries in 1995 and 2005

The bar chart presented the information about employment rates among 6 countries in between 1995 and 2005. Overall, both male and female employee in 2005 is higher than in 1995. Male employee got a higher rates in every countries in 2005. Furthermore, the female employee in 1995 got a lower rates every countries. In terms […]

The following chart illustrates the results of a British survey taken in 2005 related to Housing preferences of UK people.

The bar chart compares London, Oxford, and Cambridge in terms of housing preferences in four different categories such as apartments, terraced houses, detached houses, and semi-detached houses. Overall, apartments were the most popular type of housing in Liverpool, while semi-detached houses were preferred by the largest proportions of people in London and Manchester. It is […]

The following chart illustrates the results of a British survey taken in 2005 related to Housing preferences of UK people.

The bar chart compares the housing preferences of people in three British cities, namely Liverpool, London, and Manchester, according to a survey conducted in 2009. Overall, apartments were the most popular choice in Liverpool, whereas semi-detached houses were preferred by most people in London and Manchester. In contrast, terraced houses were the least popular type […]

The following chart illustrates the results of a British survey taken in 2005 related to Housing preferences of UK people.

The bar chart illutrates the acconmodations of people in three UK cities, namely Liverpool, London and Manchester in 2009. The figures are given as percentages for four types of housing: apartments, terraced houses, detached houses and semi-detached houses. Overall, apartments were the most popular type of housing in Liverpool, while people in London and Manchester […]

The chart below shows the percentage of people of different age groups attending three types of concerts.

The given bar chart illustrates the proportion of people who attend different types of music shows coming from varied age cohorts. Overall, pop concerts attracted the most audiences from the aged 15 to 44 cohorts, with the youngest age group being the highest. Meanwhile, opera concerts were more popular among those aged between 45 and […]

The following chart illustrates the results of a British survey taken in 2005 related to Housing preferences of UK people.

The bar chart illustrades the housing preferences of people in three UK cities: Liverpool, London and Manchester which based on a survey from 2009 Overall, most of people in Liverpool chose apartment while London and Manchester residents liked semi detached and detached house. Apartments were the preferred option in Liverpool, chosen by approximately 58%. It […]

See All
We have detected unusual activity on your device.
Please verify your identity to continue.
Note: This verification step won't sign you in. If you have a premium account, please log in to access the service as usual.
Google/Gmail Verification
Or verify using Email/Code
We've sent a verification code to:
youremail@gmail.com (Not your email?)
Enter it below to complete the verification process.
Ensure your email address is correct, your inbox is not full, and you check your spam folder. If no email arrives, consider using an alternative email.
You will need a Premium plan to perform your action!
Note: If you already have a premium account, please log in to access our services as usual.

Plans & Pricing

Our mission is to make quality education accessible for everyone.
However, to keep our hardworking team running and this service alive, we genuinely need your support!
By opting for a premium plan, not only do you sustain us in achieving the mission, but you also unlock advanced features to enrich your learning experience.

Free

For learners who aren't pressed for time

What's included on Free
100+ Cambridge IELTS Tests
Instant IELTS Writing Task 1 & 2 Evaluation (2 times/month)
Instant IELTS Speaking Part 1, 2, & 3 Evaluation (2 times/month)
Instant IELTS Writing Task 1 & 2 Essay Generator (2 times/month)
500+ Dictation & Shadowing Exercises
100+ Pronunciation Exercises
Flashcards
Other Advanced Tools

Premium

For those serious about advancing their English proficiency, and for IELTS candidates aspiring to boost their band score by 1-2 points (especially in writing & speaking) in just 30 days or less

What's included on Premium
Save Your IELTS Test Progress & Analyze Mistakes By Question Type
Save Your Own Flashcard Sets & Use Them On Any Device
Unlock All Courses, IELTS Tests, Section & Part Practice
Unlimited AI Conversations
Unlimited AI Writing Enhancement Exercises
Unlimited IELTS Writing Task 1 & 2 Evaluation
Unlimited IELTS Speaking Part 1, 2, & 3 Evaluation
Checked Answers Will Not Be Published
Unlimited IELTS Writing Task 1 & 2 Essay Generator
Unlimited IELTS Speaking Part 1, 2, & 3 Sample Generator
Unlimited Usage Of Advanced Tools & AI Features
Priority Support within 24h (12-month plan only)

Due to the nature of our service and the provided free trials, payments are non-refundable.