Our system will evaluate the answer based on this AI-generated description.
The image presents a line graph detailing the number of tourists visiting a Caribbean island from 2010 to 2017, depicting three distinct categories: visitors staying on cruise ships, visitors staying on the island, and the total. In 2010, visitors staying on cruise ships numbered approximately 0.25 million, visitors staying on the island about 0.75 million, and the total reached 1 million. By 2011, cruise ship visitors rose to around 0.5 million, island visitors slightly decreased to approximately 0.7 million, and the total reached roughly 1.3 million. In 2012, cruise ship visitors were approximately 0.9 million, island visitors stable at about 0.75 million, and the total climbed to approximately 1.6 million. By 2013, cruise ship visitors approached 1 million, island visitors increased to around 1 million, and the total stood at roughly 2 million. In 2014, cruise ship visitors remained around 1 million, island visitors approximately 1.2 million, and the total grew to about 2.2 million. In 2015, cruise ship visitors were just under 1.5 million, island visitors about 1.3 million, and the total was 2.5 million. By 2016, cruise ship visitors reached nearly 1.75 million, island visitors rose to around 1.5 million, and the total was 3 million. In 2017, cruise ship visitors totaled 2 million, island visitors peaked at roughly 1.5 million, resulting in a total of 3.5 million.
Given the complexity of the image, the above description may not be entirely accurate.
Skyrocket your IELTS band score by 1-2 points in under a month with our premium plan!
Note: Both the topic and the answer were created by one of our users.
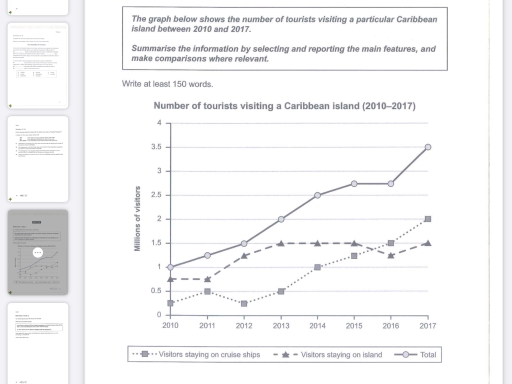
The line graph demonstrates the number of tourists visiting a Caribbean island from 2010 to 2017.
Overall, the total number of tourists increased significantly over the period. In addition, visitors staying on cruise ships showed a considerable rise, while the number of tourists staying on the island remained relatively stable after 2013.
The first group consist is Visiters staying on cruse ships (S.C.S). At the beginning of perid , lower than 0.5 million people chose to stay on cruise ships. However, in the following year number always fluctuated from 2010 to 2013. By 2017, figure significantly grown, increasing from 0.5 million to 2 million.
The second group includes those staying in the Island (S.I). In 2010, the numbers of S.I was three times more than S.C.S totaling 0.75 million. Then, the figure remained stable until the following years. After that, number of S.C.S was go up from 0.75 million to 1.5 million, and stayed stable until 2015. From 2015 to 2016, fell to just below 1.5 million and after an initial decline, the figure sligly rose again to 1.5 million.
Word Count: 180