Our system will evaluate the answer based on this AI-generated description.
The image is a bar chart depicting estimated world illiteracy rates by region and gender for the last year. The vertical axis represents the percentage of illiteracy, with markers at 10% intervals up to 60%. The horizontal axis displays regions: Developed Countries, Latin America, Sub-Saharan Africa, Arab States, South Asia, and South East Asia. Each region has two bars side by side, representing male and female illiteracy percentages. Developed Countries shows around 1% male and less than 1% female illiteracy. Latin America indicates just under 10% for males and just over 10% for females. Sub-Saharan Africa displays around 30% male and over 40% female illiteracy. Arab States present just over 20% for males and approximately 40% for females. South Asia has roughly 30% male and just over 50% female illiteracy. South East Asia reveals around 10% male and below 20% female illiteracy.
Given the complexity of the image, the above description may not be entirely accurate.
Skyrocket your IELTS band score by 1-2 points in under a month with our premium plan!
Note: Both the topic and the answer were created by one of our users.
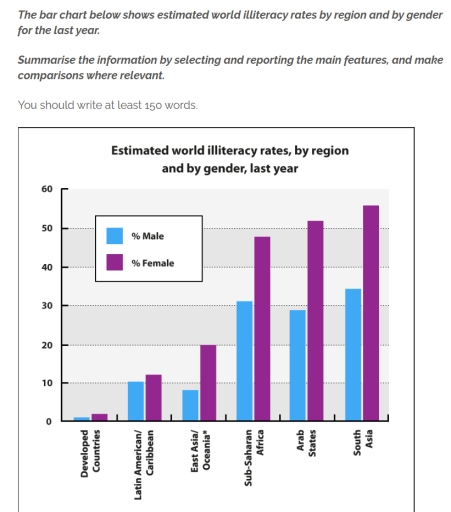
The bar chart provides detailed information about the rate of illiteracy among society across six categories.
Looking at the overall perspective, the rates for women are higher than for men in every trend, and they have risen gradually. However, the statistics for males have not risen at the same pace as females’.
The latest numbers for developed countries are about 1% in that both groups of people are less represented in this category. While males accounted for about 10% in Latin America and the Caribbean, in East Asia and Oceania it is about 8%. Meanwhile, the numbers of females have increased according to the categories. Their percentages in the first, second, and third categories account for about 2%, 12%, and 20%, respectively.
On the other hand, the percentages of females are greater than those of males as well. While in Sub-Saharan Africa, Arab States, and South Asia women’s rates are approximately 48%, 52%, 56%, respectively, men’s percentages are about 31%, 29%, 35%, respectively.
The comparisons between the two genders in six categories account for approximately 1%, 2%, 12%, 17%, 13%, and 21%, respectively.
Word Count: 183