Our system will evaluate the answer based on this AI-generated description.
The image depicts a line graph with a horizontal axis ranging from 2002 to 2010 and a vertical axis from 10 to 100 with increments of 10. Five lines, corresponding to different age groups, show an upward trend over time with varying slopes. The 19-24 group starts at approximately 10 in 2002, reaching just over 10 in 2003, around 15 in 2004, about 20 in 2005, nearly 30 in 2006, roughly 35 in 2007, approximately 45 in 2008, just under 55 in 2009, and around 65 in 2010. The 25-35 group commences at roughly 20 in 2002, increasing to around 30 in 2003, 40 in 2004, 50 in 2005, nearly 60 in 2006, just above 60 in 2007, about 70 in 2008, around 80 in 2009, and approximately 90 in 2010. The 36-45 group begins at just above 20 in 2002, growing to about 30 in 2003, nearly 40 in 2004, just over 50 in 2005, approximately 60 in 2006, about 70 in 2007, roughly 80 in 2008, close to 90 in 2009, and almost 100 in 2010. The 46-55 group starts at approximately 30 in 2002, increasing to around 40 in 2003, just under 50 in 2004, about 60 in 2005, over 70 in 2006, around 80 in 2007, nearly 90 in 2008, and just below 100 in 2009 and 2010. The 56-65 group initiates at nearly 40 in 2002, rising to almost 50 in 2003, just under 60 in 2004, about 70 in 2005, close to 80 in 2006, approaching 90 in 2007, and reaching 100 in 2008, remaining there in 2009 and 2010. Note: Due to the lack of precision in the graph, the values for each data point are estimated to the nearest increment based on their position on the graph
Given the complexity of the image, the above description may not be entirely accurate.
Skyrocket your IELTS band score by 1-2 points in under a month with our premium plan!
Note: Both the topic and the answer were created by one of our users.
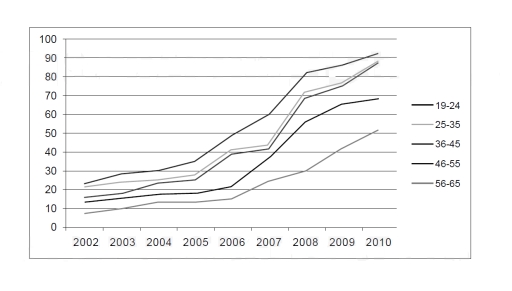
The given line graph illustrates the proportion of employees in Australia aged 19 to 65 using chat for workplace communication purposes over eight years (2002–2010). Overall, it can be seen that the text messaging trend experienced a significant climb within a timeline. However, the rate of growth in each age group is uneven. Those aged 36–45, 19–24, and 25–35 have the most prominent incline among others.
According to the data, the starting point for those aged 36–45 using chat for communication during office hours was around 17%. Then, it rose considerably by 71% in 2010. Similarly, the percentages of 25-35 and 19-24 age group workers stood just above 20%. Their figure saw an incline throughout the remaining years. For 25-35-year-old workers, their trend grew up to 88%, while for 19-24-year-old workers, it continuously rose until it reached its peak at 92%.
The rest of the adult workers’ age groups, 46–55 and 56–55, in the initial year only had around 8% and 13%, respectively. Although throughout the years they witnessed a gradual incline, their figures were the least compared to the others. The highest percentage for the 46–55 age group was only around 54% in the ultimate year, while that for the oldest age group only accounted for about 44% in the same year.
Word Count: 213