Our system will evaluate the answer based on this AI-generated description.
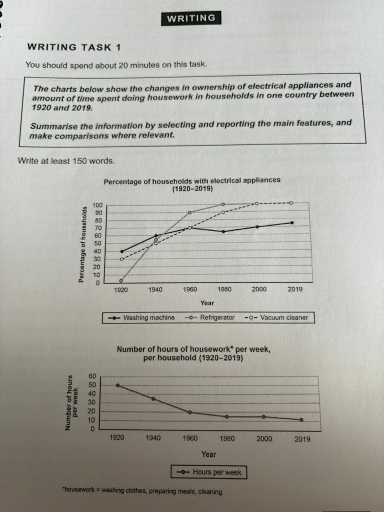
The image displays two charts: first chart "Percentage of households with electrical appliances (1920–2019)" shows three appliances' data from 1920 to 2019; Washing machine starts at 40% in 1920, reaches 50% around 1940, passes 70% by 1960, remains stable around 70% till 1980, rises to about 75% by 2000, and slightly increases to approximately 75% in 2019; Refrigerator starts at 0% in 1920, about 2% in 1940, climbs to 35% by 1960, jumps to 90% by 1980, 100% from 2000 to 2019; Vacuum cleaner starts at 30% in 1920, 45% by 1940, 70% by 1960, about 90% by 1980, 100% by 2000–2019. The second chart "Number of hours of housework* per week, per household (1920–2019)" shows hours decline steadily; starts at 50 hours in 1920, decreases to about 40 hours in 1940, drops to about 20 hours by 1960, falls to about 10 hours by 1980, and further drops below 10 hours in 2000, remaining stable through 2019.
Given the complexity of the image, the above description may not be entirely accurate.
Skyrocket your IELTS band score by 1-2 points in under a month with our premium plan!
Note: Both the topic and the answer were created by one of our users.
The graphs illustrate the changes in the possesion of electrical devices in households, as well as the number of time spent on housework from 1920 to 2019. The electric equipments included are washing machines, refrigerators, and vacuum cleaners.
Overall, it is clearly presented that the proportion of people owning electrical appliances has rised within the change in time, whereas the number of time doing housework has gradually waned.
Now focusing on the details, the usage of refrigerators have increased the quickest to hit a 100% of households out of the 3 equipments, which was in 1980, with an exponential growth of 0% to 90% between 1920 and 1960. The vacuum cleaner was owned in every household by 1980. Both the use of refigerators and vacuum cleaners have stopped expanding at one point and remained still at 100%, which was 1980 for refrigerators and 2000 for vacuum cleaners.
Shifting the attention on housework, it shows a rapid decrease of time spent from 1920 to 1960, which scored 50 hours per week to 20 hours. A dull decrease then continues from 1960 until 2019, ending with a total of slightly over 10 hours every week.
Word Count: 193
