Our system will evaluate the answer based on this AI-generated description.
The image displays a line graph of recycling rates for selected materials from 1982-2010. Paper & cardboard recycling began at nearly 70% in 1982, dipping to 65% in 1986, rising to 75% in 1990, a peak near 80% in 1994-1998, slight dip to just below 80% in 2002, and slowly declining to nearly 70% by 2010. Glass containers started at approximately 50% in 1982, a slight rise to 55% in 1986, decreasing to near 50% in 1990, rising to 60% in 1994, maintaining until 2002, and increasing to just above 60% by 2010. Aluminum cans began near 5% in 1982, rising sharply to 45% in 1986, continual rise to 65% in 1990, fluctuation between 65-70% until 2002, and a steady increase to 75% by 2010. Plastics started just above 0% in 1982, slight increase to approximately 7% in 1986, gradual rise to just below 15% in 1990, steady increase to just above 20% in 1994, reaching nearly 40% in 2002, and a sharper rise to just below 70% by 2010.
Given the complexity of the image, the above description may not be entirely accurate.
Skyrocket your IELTS band score by 1-2 points in under a month with our premium plan!
Note: Both the topic and the answer were created by one of our users.
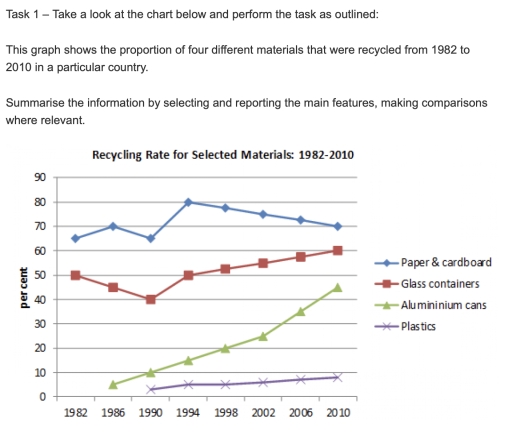
The line graph illustrates the percentage of recycled waste consisting of paper & cardboard, glass containers, aluminium cans, and plastics during the period 1982-2020.
Overall, the paper-based materials consistently led the figures among other categories, followed by the glass materials. Aluminium cans climbed steadily, while the plastic materials showed an unnoticeable rise and remained the lowest level across the period.
In 1990, the paper waste started at about 65% and 50%, respectively, and experienced a fluctuation until 1994, with 80% of recycled papers followed by the glass materials at 50%. After that, the glass material continued to rise steadily until 60% at the end of the period, whereas the recycling of paper and cardboard gradually declined to 70%.
The recycling rate of cans and the plastics presented a different starting point, with the former starting by 1986 and the latter in 1990; both of the figures accounted for roughly 5%. Additionally, by 2010 the plastic recycling percentages recorded a modest growth, at around 10%, whereas the aluminium materials surged significantly to nearly 50%.
Word Count: 173
