Our system will evaluate the answer based on this AI-generated description.
The image displays a line graph of recycling rates for selected materials from 1982-2010. Paper & cardboard recycling began at nearly 70% in 1982, dipping to 65% in 1986, rising to 75% in 1990, a peak near 80% in 1994-1998, slight dip to just below 80% in 2002, and slowly declining to nearly 70% by 2010. Glass containers started at approximately 50% in 1982, a slight rise to 55% in 1986, decreasing to near 50% in 1990, rising to 60% in 1994, maintaining until 2002, and increasing to just above 60% by 2010. Aluminum cans began near 5% in 1982, rising sharply to 45% in 1986, continual rise to 65% in 1990, fluctuation between 65-70% until 2002, and a steady increase to 75% by 2010. Plastics started just above 0% in 1982, slight increase to approximately 7% in 1986, gradual rise to just below 15% in 1990, steady increase to just above 20% in 1994, reaching nearly 40% in 2002, and a sharper rise to just below 70% by 2010.
Given the complexity of the image, the above description may not be entirely accurate.
Skyrocket your IELTS band score by 1-2 points in under a month with our premium plan!
Note: Both the topic and the answer were created by one of our users.
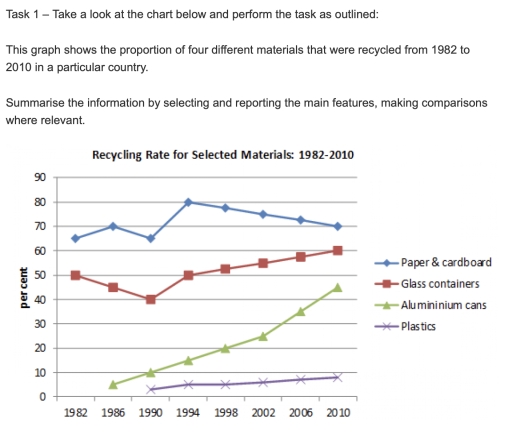
The line graph illustrates the percentage of the recycling rate for four different materials between 1982 to 2010 in specific country.
Overall, The percentage of the recycling rate was increased for most of materials, with noticeable fluctuations for Paper cardboard and Glass containers and rapidly increase for Aluminium cans.
In detail, There was a rapid surge in Aluminium can from around 5% increasing to peak approximately 45% from 1986 to 2010. Similarly, The Plastics were gradual rose from 0 to the peak at around 9%. Besides, The Glass containers experienced minor fluctuations with an overall rose until reached around 60% in 2010.
However, The graph showed that there is one material was in the downtrend at the end of during period, which is Paper and Cardboard, From 1982 to 1994 the Paper and cardboard were rose from around 65% to 80% with fluctuation between these years, which is the highest recorded. After that, The paper and Cardboard fell slightly by 10% from the peak to around 70% in 2010.
Word Count: 169