🔥 Today Only: Save 30% on Premium — Offer Ends Soon! - Upgrade Now!
Bar Chart

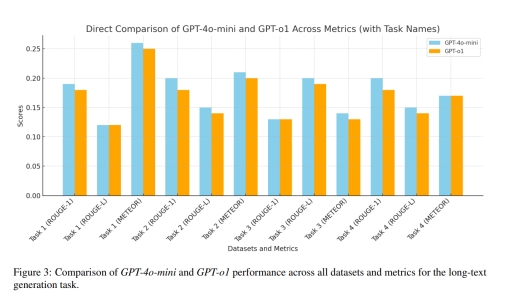
Band 5+: The bar chart below compares the performance of two artificial intelligence models, GPT-4o-mini and GPT-o1, across three evaluation metrics (ROUGE-1, ROUGE-L and METEOR) in four long-text generation tasks. Summarise the information by selecting and reporting the main features, and make comparisons where relevant.

Image for topic: The bar chart below compares the performance of two artificial intelligence models, GPT-4o-mini and GPT-o1, across three evaluation metrics (ROUGE-1, ROUGE-L and METEOR) in four long-text generation tasks. Summarise the information by selecting and reporting the main features, and make comparisons where relevant.
Our system will evaluate the answer based on this AI-generated description.
The image features a grouped bar chart titled "Direct Comparison of GPT-4o-mini and GPT-o1 Across Metrics (with Task Names)" with the caption "Figure 3: Comparison of GPT-4o-mini and GPT-o1 performance across all datasets and metrics for the long-text generation task." The vertical axis represents "Scores" ranging from 0.00 to 0.25 with increments of 0.05, and the horizontal axis lists "Datasets and Metrics" across twelve paired comparisons for GPT-4o-mini and GPT-o1, respectively: Task 1 (ROUGE-1) at ~0.19 vs. ~0.18; Task 1 (ROUGE-L) at ~0.12 vs. ~0.12; Task 1 (METEOR) at ~0.26 vs. ~0.25; Task 2 (ROUGE-1) at ~0.20 vs. ~0.18; Task 2 (ROUGE-L) at ~0.15 vs. ~0.14; Task 2 (METEOR) at ~0.21 vs. ~0.20; Task 3 (ROUGE-1) at ~0.13 vs. ~0.13; Task 3 (ROUGE-L) at ~0.20 vs. ~0.19; Task 3 (METEOR) at ~0.14 vs. ~0.13; Task 4 (ROUGE-1) at ~0.20 vs. ~0.18; Task 4 (ROUGE-L) at ~0.15 vs. ~0.14; and Task 4 (METEOR) at ~0.17 vs. ~0.17.
Given the complexity of the image, the above description may not be entirely accurate.
Note: Both the topic and the answer were created by one of our users.

The illustration gives information about comparison between GPT-40 and GPT-01 across different metrics. Overall, GPT-40 outperforms and achieve highest scores from GPT-01. The task 1 meteor was dominant candidate among all other dataset, where both GPT-40 and 01 are on the top in scores. In contrast, ROUGE-L gains scores hovering around 0.19 for both artificial intelligence models.

It is quite evident from the bar graph that in task 1, GPT-1 does not score higher comparing with other version. Rouge-1 score is 0.18 and 0.19 approximately for GPT-mini and GPT-1 respectively. In contrast, task 2 has no longer strikingly different results from task 1. The meteor achieves higher scores approximately 0.21 tailoring behind Rouge-1 and Rouge-L.

Furthermore, a similar pattern is seen in task 3 and task 4. In task 3, ROUGE-L obtains higher scores around 0.20 compared with meteor and ROUGE-1. Meanwhile, In task 4, all gain approximately same marks, but ROUGE-1 is still leading the trend.

Word Count: 157

Answers On The Same Topic:

The bar chart below compares the performance of two artificial intelligence models, GPT-4o-mini and GPT-o1, across three evaluation metrics (ROUGE-1, ROUGE-L and METEOR) in four long-text generation tasks. Summarise the information by selecting and reporting the main features, and make comparisons where relevant.

The provided bar charts compares the performance between GPT-4o-mini and GPT-o1 in terms of metrics and datasets in a particular long-text generation work. Overall, this assessment involves three types of tasks, which is labelled as ROUGE-L, METEOR and ROUGE-L respectively and repeated four times. GPT-4o-mini’s performance surpasses GPT-o1 at almost every testing round, particularly at […]

See All

Other Topics:

The chart below shows the percentage of people of different age groups attending three types of concerts.

The bar chart compares the percentages of Australians in five age groups who attended three types of music events, namely classical, opera and popular music, in 2006. Overall, popular music events were the most widely attended among younger age groups, whereas opera was relatively more popular among middle-aged and older people. Classical music attracted the […]

The graph below shows the percentage of urban/suburban and rural households in a certain country that had Internet access between 2011 and 2016. Summarize' the information by selecting and reporting the main features, and make comparisons where relevant.

The chart displays the percentage of viken/fuburban late house lund internet access in urban/suburban and rural areas of a certain country from 2011 to 2016. the Boch figures are shown to increase as the years go by. Notably, the figures shewing the rise of urban/suburban household internet accessibility has a far more higher percentage than […]

Percentae of People who ate five portions of fruit and vegetables

The chart illustrates the proportion of the UK people who ate five portions of fruit and vegetables per day from 2001 to 2008. Overall, female has the highest number throughout the period compared to men and children. Three of them had a slight decrease at the end of the year. First of all, in 2001 […]

The chart below shows the favourite leisure activities among girls and boys

The bar chart compares the percentages of teenage boys and girls in Canada who identified four different leisure activities as their favourite. Overall, there were clear differences between the preferences of the two genders. Shopping was by far the most popular activity among boys, whereas music was the only activity that was equally popular with […]

The chart shows the percentage of household expenditure on goods and services in a country from 1995 to 2005. Summarise the information by selecting and reporting the main features and make comparisons where relevant.

The provided bar chart represent the data about the propostion of households spent on goods and services in a notion between 1995 to 2005 . overall, it is lucid that in past time most of people spent on bevrages and other goods and services. However, in 2005 higher households spend on housing. To commence with, […]

The graph below shows the percentage of self employed workers of the total workforce in five countries in 1998 and 2008.

The bar graph illustrates the percentage of self employed workers of the total workforce in five countries between 1998 and 2008. Overall, it can be seen that there were some noticeable changes. Turkey was the most popular category, while Russian Republice recorded lowest figure. Looking at the details, in 1998, the proportion of self employed […]

See All
We have detected unusual activity on your device.
Please verify your identity to continue.
Note: This verification step won't sign you in. If you have a premium account, please log in to access the service as usual.
Google/Gmail Verification
Or verify using Email/Code
We've sent a verification code to:
youremail@gmail.com (Not your email?)
Enter it below to complete the verification process.
Ensure your email address is correct, your inbox is not full, and you check your spam folder. If no email arrives, consider using an alternative email.
You will need a Premium plan to perform your action!
Note: If you already have a premium account, please log in to access our services as usual.

Plans & Pricing

Our mission is to make quality education accessible for everyone.
However, to keep our hardworking team running and this service alive, we genuinely need your support!
By opting for a premium plan, not only do you sustain us in achieving the mission, but you also unlock advanced features to enrich your learning experience.

Free

For learners who aren't pressed for time

What's included on Free
100+ Cambridge IELTS Tests
Instant IELTS Writing Task 1 & 2 Evaluation (2 times/month)
Instant IELTS Speaking Part 1, 2, & 3 Evaluation (2 times/month)
Instant IELTS Writing Task 1 & 2 Essay Generator (2 times/month)
500+ Dictation & Shadowing Exercises
100+ Pronunciation Exercises
Flashcards
Other Advanced Tools

Premium

For those serious about advancing their English proficiency, and for IELTS candidates aspiring to boost their band score by 1-2 points (especially in writing & speaking) in just 30 days or less

What's included on Premium
Save Your IELTS Test Progress & Analyze Mistakes By Question Type
Save Your Own Flashcard Sets & Use Them On Any Device
Unlock All Courses, IELTS Tests, Section & Part Practice
Unlimited AI Conversations
Unlimited AI Writing Enhancement Exercises
Unlimited IELTS Writing Task 1 & 2 Evaluation
Unlimited IELTS Speaking Part 1, 2, & 3 Evaluation
Checked Answers Will Not Be Published
Unlimited IELTS Writing Task 1 & 2 Essay Generator
Unlimited IELTS Speaking Part 1, 2, & 3 Sample Generator
Unlimited Usage Of Advanced Tools & AI Features
Priority Support within 24h (12-month plan only)

Due to the nature of our service and the provided free trials, payments are non-refundable.