24 Hours Only: Get 39% OFF on Our Premium Plan - Check Out Now!
Bar Chart

Band 5+: The bar chart below shows average UK salaries, by city. Summarise the information by selecting and reporting the main features, and make comparisons where relevant..

Image for topic: The bar chart below shows average UK salaries, by city. Summarise the information by selecting and reporting the main features, and make comparisons where relevant..
Our system will evaluate the answer based on this AI-generated description.
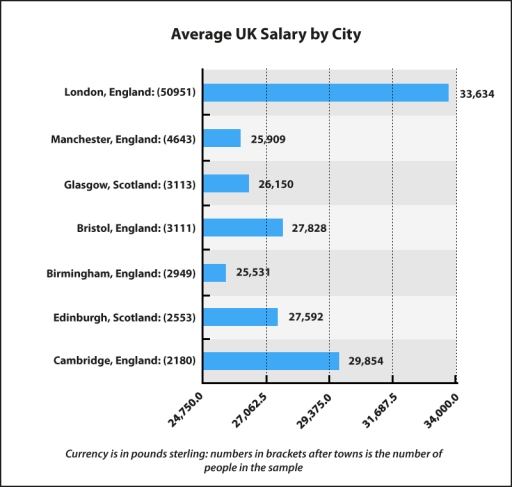
The image displays a bar graph titled "Average UK Salary by City", with seven cities listed along the Y-axis and the average salary amounts displayed in ascending order along the X-axis. London, England has the highest average salary of 33,634 with a sample size of 50951. Cambridge, England has the second-highest salary of 29,854 with a sample size of 2180. Bristol, England follows with a salary of 27,828 and a sample size of 3111. Edinburgh, Scotland has a salary of 27,592 with a sample size of 2553. Glasgow, Scotland's average salary is 26,150 with 3113 people in the sample. Manchester, England has an average salary of 25,909 and a sample size of 4643. The lowest average salary is in Birmingham, England at 25,531 with 2949 people in the sample. The label at the bottom reads "Currency is in pounds sterling; numbers in brackets after towns are the number of people in the sample".
Given the complexity of the image, the above description may not be entirely accurate.
Note: Both the topic and the answer were created by one of our users.

The bar chart compares the average pay in pound sterling of cities of England and Scotland.

Earnings vary across all the cities of England. London with a sample size of just over 50,000 records the highest average salary of 33,634 pound sterling. While, the people of Birmingham and Manchester earns the lowest at 25,531 and 25.909 respectively. Bristol and Cambridge, both have recorded a high figure of 27,828 and 29,854 respectively when compared to the other cities of the same country.

On the other hand, Scotland witnesses a similar average income. Among over 2500 people participated in the sampling process and the earnings comes out to be 26,150 in Glasgow and 29,854 inn Edinburgh.

Overall, it can be seen that, income varies in England than in Scotland which has a stable figure. People of London earns far much higher than other cities, while people of Birmingham earns the lowest. This shows the variability of amount earned among people of the same country.

Word Count: 162

Answers On The Same Topic:

The bar chart below shows average UK salaries, by city. Summarise the information by selecting and reporting the main features, and make comparisons where relevant..

The bar chart demonstrates the average UK income in different cities. Overall, a distinct pattern emerges, revealing the income gap between the capital cities and other cities. Alongside, there are notable variations in the average income between different cities. Initially, a comparison of all cities highlights London, the capital of England, with the highest average […]

The bar chart below shows average UK salaries, by city. Summarise the information by selecting and reporting the main features, and make comparisons where relevant..

The bar chart illustrates the average salaries across seven cities in the United Kingdom. Overall, there is a significant disparity in average wages among the cities, with London leading by a considerable margin, while Birmingham reports the lowest salary figures. London commands the highest average salary at £33,634, based on a substantial sample size of […]

The bar chart below shows average UK salaries, by city. Summarise the information by selecting and reporting the main features, and make comparisons where relevant..

The bar chart illustrates average salaries for each of the eight UK cities. Overall, there is a significant disparity not only in median wages but also in the number of surveyed people; they considerably vary by city. While London has the outstanding average salary, other cities reported much lower figures. However, most of the numbers […]

The bar chart below shows average UK salaries, by city. Summarise the information by selecting and reporting the main features, and make comparisons where relevant..

The graph below illustrates the average salaries in seven cities in the United Kingdom. Overall, employees in most of the cities in England earn more than in Scotland. According to the bar chart, over 50,000 London employees attend this survey, and they gain the highest average wages among seven cities, with 33,634 pounds. In contrast, […]

The bar chart below shows average UK salaries, by city. Summarise the information by selecting and reporting the main features, and make comparisons where relevant..

The bar chart provides information about the average UK salary in pounds among large British cities. On top of the graph, the capital city London pops up first, with the highest salary (£33,634), followed by the ancient Cambridge (where the gain drops to £29,854). Then we have Bristol and Edinburgh with a wage of around […]

See All

Other Topics:

The chart below shows estimated illiteracy rates by region and by gender for the year 2000. write a report for a university lecturer describing the information below.

The chart below illustrates approximate rates of 2000 by region and by sex. Overall, while Africa, Arab States and South Asia has high amount of illiteracy rate, Latin America, East Asia and Developed countries has low illiterate percent. Another noticeable point is Female populations illeteracy rates are more than male’s all over the world By […]

the chart below show the percentage of people in a city in the UK using the internet for different activities in 2007 and 2009.

The chart provides information about the number of people in a city in the UK who use the Internet for different activities in 2007 and 2009. Overall, the shopping topped the list of activities both in 2007 and 2009. Meanwhile, the learning and the TV were the least common categories. Focusing on the music, it […]

The chart below shows information about fuel used in the transport sector in different countries in Europe, compared to the EU average, in 2009 and 2010.

The given chart illustrates the proportion of fuel consumption in the transport field in different nations in Europe, compared to the EU average, from 2009 to 2010. Overall, while Slovakia, Spain and the EU average witnessed a decrease in their percentage of fuel used over the period, the figure for Italy, France and Greece increased […]

The chart below shows information about fuel used in the transport sector in different countries in Europe, compared to the EU average, in 2009 and 2010.

The bar chart illustrates the proportion of fuel consumed in the transport sector across six different EU nations and the EU average between 2009 and 2010. Overall, there was an increase in the percentage of petrol consumption for the transport sector in Italy, France, and Greece, while a reverse trend was observed in the remaining […]

The bar chart below shows the spending of 18 - 20 people in five different activity.

The bar chart illustrates spending by 18-20-year-olds in one country on five different products in 2010 and 2014. Overall, it is clear that food , smartphones and toiletries increased in 2014, but clothes did not have any differences. However, books had a fall in 2014 , in 2010 it was the lowest in rate of […]

The percentage of women going into higher education in five countries for five years 1980 to 2015.

The bar chart portrays the details on the percentage of women going into higher education in five countries for the years 1980 and 2015. When we look at the chart, we can identify that the horizontal axis represents number of presentage while the other y-axis indicates countries. Overall, examining this one, we find that in […]

See All
We have detected unusual activity on your device.
Please verify your identity to continue.
Note: This verification step won't sign you in. If you have a premium account, please log in to access the service as usual.
Google/Gmail Verification
Or verify using Email/Code
We've sent a verification code to:
youremail@gmail.com (Not your email?)
Enter it below to complete the verification process.
Ensure your email address is correct, your inbox is not full, and you check your spam folder. If no email arrives, consider using an alternative email.
You will need a Premium plan to perform your action!
Note: If you already have a premium account, please log in to access our services as usual.

Plans & Pricing

Our mission is to make quality education accessible and free for everyone.
However, to keep our hardworking team running and this service alive, we genuinely need your support!
By opting for a premium plan, not only do you sustain us in achieving the mission, but you also unlock advanced features to enrich your learning experience.

Free

For learners who aren't pressed for time

What's included on Free
1000+ IELTS Tests & Samples
Instant IELTS Writing Task 1 & 2 Evaluation (2 times/month)
Instant IELTS Speaking Part 1, 2, & 3 Evaluation (5 times/month)
Instant IELTS Writing Task 1 & 2 Essay Generator (2 times/month)
500+ Dictation & Shadowing Exercises
100+ Pronunciation Exercises
Flashcards
Other Advanced Tools

Premium

For those serious about advancing their English proficiency, and for IELTS candidates aspiring to boost their band score by 1-2 points (especially in writing & speaking) in just 30 days or less

What's included on Premium
Save Your IELTS Test Progress
Unlock All Courses & Content
Unlimited AI Conversations
Unlimited AI Writing Enhancement Exercises
Unlimited IELTS Writing Task 1 & 2 Evaluation
Unlimited IELTS Speaking Part 1, 2, & 3 Evaluation
Checked Answers Will Not Be Published
Unlimited IELTS Writing Task 1 & 2 Essay Generator
Unlimited IELTS Speaking Part 1, 2, & 3 Sample Generator
Unlimited Usage Of Advanced Tools

Due to the nature of our service and the provided free trials, payments are non-refundable.
Nếu bạn là người Việt Nam và không có hoặc không muốn trả bằng credit/debit cards, bạn có thể thanh toán bằng phương thức chuyển khoản:


Chọn gói:
279,000₫ 157,000 ₫ cho gói 1 tháng (chỉ 5,233₫/ngày)
819,000₫ 397,000 ₫ cho gói 3 tháng (chỉ 4,411₫/ngày)
1,649,000₫ 667,000 ₫ cho gói 6 tháng (chỉ 3,706₫/ngày)
3,299,000₫ 857,000 ₫ cho gói 12 tháng (chỉ 2,381₫/ngày)


Sau khi chuyển khoản, vui lòng đợi trình duyệt tự động điều hướng bạn trở lại Engnovate và bạn sẽ ngay lập tức nhận được mã kích hoạt tài khoản premium.
Nếu có lỗi xảy ra, bạn có thể liên hệ với team thông qua một trong các phương thức: email đến helloengnovate@gmail.com hoặc nhắn tin qua facebook.com/engnovate.
Vì toàn bộ công cụ trên website đều có thể sử dụng thử miễn phí, Engnovate không hỗ trợ hoàn tiền.