🔥 Today Only: Save 30% on Premium — Offer Ends Soon! - Upgrade Now!
Multiple Graphs

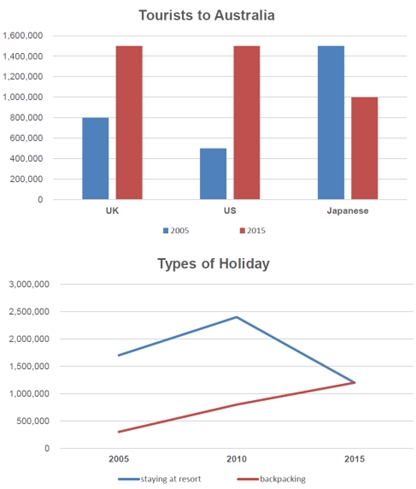
Band 4+: The bar chart below shows the number of tourists in three nations who travel to Australia in 2005 and 2015. The graph below shows the number of tourists who use two types for holiday.

Image for topic: The bar chart below shows the number of tourists in three nations who travel to Australia in 2005 and 2015. The graph below shows the number of tourists who use two types for holiday.
Our system will evaluate the answer based on this AI-generated description.
The image consists of two sections depicting two different graphs. The upper graph titled "Tourists to Australia" showcases the number of tourists from the UK, US, and Japan in two distinct years, 2005 and 2015. It shows UK tourists: approximately 1,200,000 in 2005 and about 1,100,000 in 2015; US tourists: roughly 600,000 in 2005 and nearly 1,400,000 in 2015; Japanese tourists: around 800,000 in 2005 and close to 600,000 in 2015. The lower graph titled "Types of Holiday" illustrates the number of tourists staying at a resort and those backpacking from 2005 to 2015. Resort stays reached their highest at approximately 2,500,000 in 2010, with the values around 1,750,000 in 2005 and close to 1,500,000 in 2015. Backpacking numbers started at about 2,000,000 in 2005, peaked at approximately 1,500,000 in 2010, and fell to around 1,000,000 in 2015.
Given the complexity of the image, the above description may not be entirely accurate.
Note: Both the topic and the answer were created by one of our users.

There are two statistical information presented, the bar chart illustrates tourist nationalities of the UK, US, and Japan that visits Australia of 2005 and 2015. The line graph presents types of holiday by staying at resorts and backpacking.

According to the bar chart, Japanese nationals make up over 1.4 million in 2005, in comparison to the English tourist which consist of 80 thousand and US tourist of over 40 thousand. However, in 2015, Japanese visitor numbers dropped 1/3, reaching 1 million. More visitors can from the UK and US, which they combined together account for over 1.4m each.

As can be seen from the following line graph from 2005 to 2010, both backpacking and resort stays increased in Australia of from less than 500,000 to 750,000 and 1.7 million to 2 million respectively. But the trend did not last long for resorts as it reached its peak, tourist numbers decreased from 2010 to 2015 to reaching 1.3 million. While backpacking became more popular reaching 1.3 million in 2015 as well.

To conclude, visitor numbers to Australia from US and UK increased whist backpacking become more attractive as opposed to staying in resorts.

Word Count: 192

Answers On The Same Topic:

The bar chart below shows the number of tourists in three nations who travel to Australia in 2005 and 2015. The graph below shows the number of tourists who use two types for holiday.

The charts illustrate the number of tourists visiting Australia from the UK, the US, and Japan in 1995 and 2005, alongside the various types of travel during that period. Overall, there was an increase in tourist numbers from the UK and the US, while the number of tourists from Japan saw a decline. In terms […]

The bar chart below shows the number of tourists in three nations who travel to Australia in 2005 and 2015. The graph below shows the number of tourists who use two types for holiday.

The charts show the number of tourists to Australia from the UK, the US, and Japan in 1995 and 2005, and the types of travel over the same period. Overall, tourist numbers from the UK and the US increased, while those from Japan declined. In terms of travel type, backpacking was more popular until 2000 […]

The bar chart below shows the number of tourists in three nations who travel to Australia in 2005 and 2015. The graph below shows the number of tourists who use two types for holiday.

The provided charts present detailed information regarding the influx of tourists to Australia from the United Kingdom, the United States, and Japan during two distinct years, 1995 and 2005, as well as the preferred types of holiday accommodations from 2005 to 2015. In general, the data reveals an overall increase in tourism from both the […]

The bar chart below shows the number of tourists in three nations who travel to Australia in 2005 and 2015. The graph below shows the number of tourists who use two types for holiday.

Presented are two charts illustrating the number of travelers in three nations and the kinds of transportation they used over one decade, from 2005 to 2015. Overall, while a wealth of visitors came to Japan more than to other countries in 2005, the opposite was true in 2015. Additionally, visitors preferred staying at resorts to […]

The bar chart below shows the number of tourists in three nations who travel to Australia in 2005 and 2015. The graph below shows the number of tourists who use two types for holiday.

The given bar chart illustrates the statistics of travelers to Australia among three different counties, namely the UK, the USA and Japan during the period between 1995 and 2000, while the line chart below represents the trend of two categories of traveling from 1995 to 2005. Overall, it is salient that the total number of […]

See All

Other Topics:

The table below shows the numbers of visitors to Ashdown Museum during the year before and the year after it was refurbished. The charts show the result of surveys asking visitors how satisfied they were with their visit, during the same two periods. Summarise the information by selecting and reporting the main features, and make comparisons where relevant. You should write at least 150 words.

The table compares the total numbers of visitors at Ashdown Museum in the year before and year after it was refurbished, while the pie illustrates survey of visitors’ satisfaction in both years. Looking from an overall perspective, both pie charts has risen satisfaction significantly, while dissatisfaction decreased considerably. According top the table, museum attracted more […]

The line graph below shows the average high and low temperatures in Glasgow, Scotland, over the course of a year, while the table provides information on the average monthly rainfall and sunshine hours. Summarise the information by selecting and reporting the main features, and make comparisons where relevant.

The provided line graph illustrates the average monthly maximum and minimum temperatures (°C) in Glasgow. Meanwhile, the table depicts the average monthly rainfall and daily sunshine’s hours in the same city. Overall, it is observed that in the line graph, the temperature’s maximum and minimum numbers both bottom out by the January before experiencing a […]

The chart below shows the changes in ownership of electrical appliances and amount of time spend doing homework in households in one country between 1920 and 2019 in one country.

The graph indicates the changes of proprietorship of electronic machines and spend much hours and minutes in housework in family unit in one state between 1920 to 2019. Overall , the number of hours spend doing work in house is raised without electric devices like washing machines , vaccum cleaner and refrigerators but rising over […]

The provided charts illustrate the different types of courses, which were followed by the students during the years of 1984, 1994 and 2004.

The pie charts illustrate various types of courses that students undertook in the years of 1984, 1994, and 2004. Overall, the majority of the students took face to face courses while the online courses contained the least part of their course percentage in all three periods. Additionally, the percentage rate for 1994 and 2004 remained […]

The pie chart below illustrates the average commuting time of UK workers in 2009, while the bar chart compares the methods of travelling to work in London and the rest of the UK in the same year.

The pie chart depicts how much time the UK population allocated to commuting to work, while the bar one illustrates how they traveled to work in 2009. Overall, it is clear that most UK commuters spent under 30 minutes on their daily travel. Additionally, people of both London and the other areas of the UK […]

You should spend about 20 minutes on this task. The charts below show the number of Japanese tourists travelling abroad between 1985 and 1995 and Australia's share of the Japanese tourist market. Write a report for a university lecturer describing the information shown below. You should write at least 150 words.

The bar chart illustrates the total number of Japanese tourists travelling overseas between 1985 and 1995, while the line graph shows the percentage of these tourists who chose Australia as their destination over the same ten-year period. Overall, both the total number of Japanese outbound travellers and Australia’s share of this tourist market experienced a […]

See All
We have detected unusual activity on your device.
Please verify your identity to continue.
Note: This verification step won't sign you in. If you have a premium account, please log in to access the service as usual.
Google/Gmail Verification
Or verify using Email/Code
We've sent a verification code to:
youremail@gmail.com (Not your email?)
Enter it below to complete the verification process.
Ensure your email address is correct, your inbox is not full, and you check your spam folder. If no email arrives, consider using an alternative email.
You will need a Premium plan to perform your action!
Note: If you already have a premium account, please log in to access our services as usual.

Plans & Pricing

Our mission is to make quality education accessible for everyone.
However, to keep our hardworking team running and this service alive, we genuinely need your support!
By opting for a premium plan, not only do you sustain us in achieving the mission, but you also unlock advanced features to enrich your learning experience.

Free

For learners who aren't pressed for time

What's included on Free
100+ Cambridge IELTS Tests
Instant IELTS Writing Task 1 & 2 Evaluation (2 times/month)
Instant IELTS Speaking Part 1, 2, & 3 Evaluation (2 times/month)
Instant IELTS Writing Task 1 & 2 Essay Generator (2 times/month)
500+ Dictation & Shadowing Exercises
100+ Pronunciation Exercises
Flashcards
Other Advanced Tools

Premium

For those serious about advancing their English proficiency, and for IELTS candidates aspiring to boost their band score by 1-2 points (especially in writing & speaking) in just 30 days or less

What's included on Premium
Save Your IELTS Test Progress & Analyze Mistakes By Question Type
Save Your Own Flashcard Sets & Use Them On Any Device
Unlock All Courses, IELTS Tests, Section & Part Practice
Unlimited AI Conversations
Unlimited AI Writing Enhancement Exercises
Unlimited IELTS Writing Task 1 & 2 Evaluation
Unlimited IELTS Speaking Part 1, 2, & 3 Evaluation
Checked Answers Will Not Be Published
Unlimited IELTS Writing Task 1 & 2 Essay Generator
Unlimited IELTS Speaking Part 1, 2, & 3 Sample Generator
Unlimited Usage Of Advanced Tools & AI Features
Priority Support within 24h (12-month plan only)

Due to the nature of our service and the provided free trials, payments are non-refundable.