Our system will evaluate the answer based on this AI-generated description.
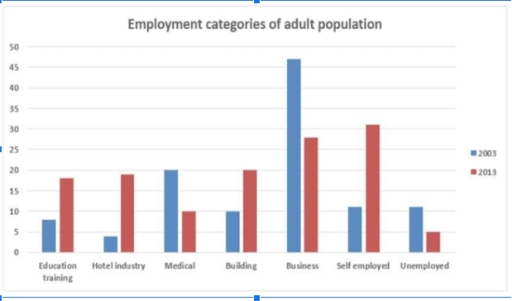
The image shows a bar chart representing the employment categories of adult population for the years 2003 and 2013. There are seven categories displayed: Education training, Hotel industry, Medical, Building, Business, Self-employed, and Unemployed. In 2003, Education training was around 10%, Hotel industry was slightly above 10%, Medical was around 5%, Building was approximately 40%, Business was slightly above 10%, Self-employed was approximately 17.5%, and Unemployed was slightly above 5%. In 2013, Education training was around 17.5%, Hotel industry was around 15%, Medical was approximately 7.5%, Building was approximately 20%, Business was approximately 32.5%, Self-employed was around 30%, and Unemployed was around 7.5%. There is a notable increase in Business and Self-employed categories, while Building saw a significant decrease from 2003 to 2013.
Given the complexity of the image, the above description may not be entirely accurate.
Skyrocket your IELTS band score by 1-2 points in under a month with our premium plan!
Note: Both the topic and the answer were created by one of our users.
The bar chart compares adults population based on their employment category in two years : 2003 and 2013. In general, half of all categories have increased their volume in 10 years, and others sectors did opposite. Firstly, business sector was leading category, nevertheless within 10 year its’ rate declined. Medical sector fell sharply, and even in. 2013 it became smallest category.
In 2003 top- four leader categories were business, medical, self employed and unemployed people. Almost all of them lost rate during 10 years. Business sector in 2003 with 45 % occupied half of the entire work area. Then during 10 years it decreased by 15%, and in 2013 it still was almost leading sector with 33%. Medical center also showed fall by 10%, and in 2013 it occupied about 17%. Unemployed adults also showed a small decline, from 17% it decreased to 14%.
Albeit not all top 4 categories showed decline, self employed adults were increased from 21% to 34 % and in 2013 it became leader sector. Hotel sector has grown from 15% to 23%. Another growth show education/training from16% it rise to 23%. Building sector also rised from 16% to 24 in 2013
Word Count: 196
