Our system will evaluate the answer based on this AI-generated description.
The image shows a bar chart representing the employment categories of adult population for the years 2003 and 2013. There are seven categories displayed: Education training, Hotel industry, Medical, Building, Business, Self-employed, and Unemployed. In 2003, Education training was around 10%, Hotel industry was slightly above 10%, Medical was around 5%, Building was approximately 40%, Business was slightly above 10%, Self-employed was approximately 17.5%, and Unemployed was slightly above 5%. In 2013, Education training was around 17.5%, Hotel industry was around 15%, Medical was approximately 7.5%, Building was approximately 20%, Business was approximately 32.5%, Self-employed was around 30%, and Unemployed was around 7.5%. There is a notable increase in Business and Self-employed categories, while Building saw a significant decrease from 2003 to 2013.
Given the complexity of the image, the above description may not be entirely accurate.
Skyrocket your IELTS band score by 1-2 points in under a month with our premium plan!
Note: Both the topic and the answer were created by one of our users.
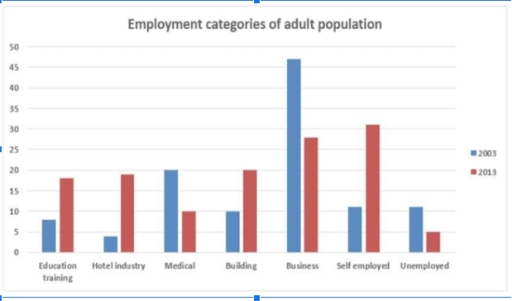
The bar chart illustrates occupation categories of adult population in the US over the period
Overall, in former year, business was the highest category while unemployment was the lowest category among all the other fields.
To begin with, in 2003, the ratio of jobs stood at 7% for education training, that higher than hotel industries employment. In medical field, employment significantly rose to 20% which doulble from the building workers. Business peaked at above 45 % that was the maximum from all of the others. Self employed and unemployed were remained same at 11%
Furthermore, in 2013, the propotion of employments in education training and hotel Industy accounted 18% and 19% respectively. Medical employment population at 10%% which half of the buildings employee. The business adult population she rose sharply to 27% whereas unemployed ratio at 5%. The highest ratio among all the categorie were belong to self employed cchich 31%.
Word Count: 151