Our system will evaluate the answer based on this AI-generated description.
The image shows a bar chart representing the employment categories of adult population for the years 2003 and 2013. There are seven categories displayed: Education training, Hotel industry, Medical, Building, Business, Self-employed, and Unemployed. In 2003, Education training was around 10%, Hotel industry was slightly above 10%, Medical was around 5%, Building was approximately 40%, Business was slightly above 10%, Self-employed was approximately 17.5%, and Unemployed was slightly above 5%. In 2013, Education training was around 17.5%, Hotel industry was around 15%, Medical was approximately 7.5%, Building was approximately 20%, Business was approximately 32.5%, Self-employed was around 30%, and Unemployed was around 7.5%. There is a notable increase in Business and Self-employed categories, while Building saw a significant decrease from 2003 to 2013.
Given the complexity of the image, the above description may not be entirely accurate.
Skyrocket your IELTS band score by 1-2 points in under a month with our premium plan!
Note: Both the topic and the answer were created by one of our users.
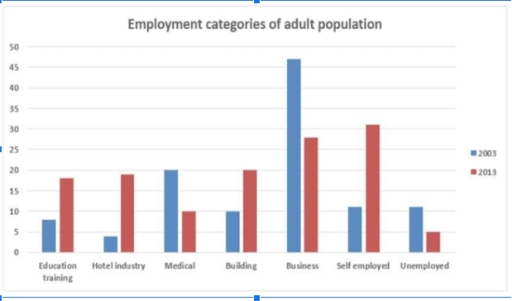
The bar chart provides information about the professional status of young adults in the US in 2003 and 2013.
Overall, it can be seen that the percentage of business and self-employed jobs showed a significant increase during the period, while the proportion jobs of in the building and hotel industries experienced a relatively slower but steady upward trend.
In 2003, the rate of business jobs was the highest rate at 47%, followed by medical, self-employed and unemployed at around 20%, 12% and 11%, while the lowest rate of employed jobs was building, education training, and hotel industries at around 10%, 8% and 4%.
In 2013, the self-employed jobs are gradually increased at around 32%, However, business jobs were significantly declined and reaching on 22%, followed by building, hotel industry, and education training jobs were rose and reaching up to 20%, 18%, and 17%. Meanwhile, the lowest rate are medical and unemployed at around 10%, and 5%.
Word Count: 156