Our system will evaluate the answer based on this AI-generated description.
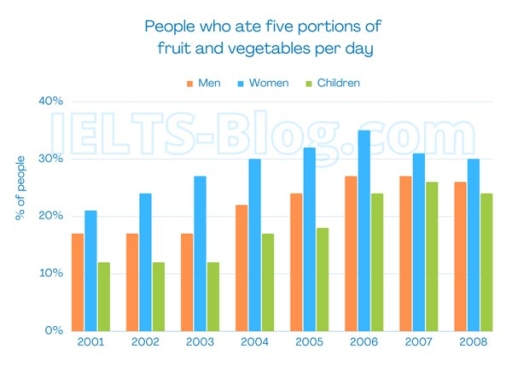
The image shows a bar chart titled "People who ate five portions of fruit and vegetables per day" with three categories: Men, Women, and Children, represented over the years 2001 to 2008. The percentage of men who ate five portions ranged from just over 20% in 2001, dipping to just below 20% in 2002, rising to about 25% in 2003, falling slightly in 2004, then increasing steadily to just over 25% in 2005, just under 30% in 2006, just over 30% in 2007, and reaching almost 35% in 2008. The percentage of women was consistently the highest, starting at just under 30% in 2001, rising to just over 30% in 2002, increasing sharply to nearly 35% in 2003, dropping slightly in 2004, then jumping to almost 40% in 2005, falling back to just over 35% in 2006, rising to nearly 40% again in 2007, and reaching 40% in 2008. The percentage of children eating five portions started at just over 10% in 2001, increased to about 15% in 2002, remained stable in 2003, rose to just over 20% in 2004, dropped back to just under 20% in 2005, increased to about 25% in 2006, remained stable in 2007, and rose to just under 30% in 2008.
Given the complexity of the image, the above description may not be entirely accurate.
Skyrocket your IELTS band score by 1-2 points in under a month with our premium plan!
Note: Both the topic and the answer were created by one of our users.
The provided chart offers insights into the proportion of the people’s consumption of fruits and vegetables on a daily basis from 2001 to 2008.
Overall , it is clear that the figures for all witnessed escalating tendencies after the surveyed period.Additionally , Man had the highest statistics throughout the period ,the opposite was true for children.
In the first year , it was Men that stood out of as the most consumed fruits with around 22% , whereas children was 13%.There was a slight increase in the figure for Men and children to 35% and 27% respectively in 2006. In comparison with men , which indicated an insignificant decrease to 30% , the similar pattern was observed in the statistics on children which dropped to 25% at the end of the period.
At the beginning of the period women was ranked second with 27% after which there was an uninterrupted upturn in the figure for women to about 28% in 2007.The year 2008 underwent an decrease in the figure for female to 25%.
Word Count: 173
