Our system will evaluate the answer based on this AI-generated description.
The image contains three graphs. The first, "What are the best things about living in London?", shows percentages across Year 1 (Y1), Year 2 (Y2), and Year 3 (Y3) for: range of shops (Y1: 48%, Y2: 44%, Y3: 42%), job opportunities (Y1: 38%, Y2: 39%, Y3: 36%), mixture of people (Y1: 37%, Y2: 37%, Y3: 35%), museums & art galleries (Y1: 29%, Y2: 34%, Y3: 35%), night life (Y1: 22%, Y2: 24%, Y3: 25%), and transport (Y1: 22%, Y2: 21%, Y3: 22%). The second graph, "What are the worst things about living in London?", shows percentages for: cost of living (Y1: 57%, Y2: 49%, Y3: 50%), traffic congestion (Y1: 55%, Y2: 55%, Y3: 49%), crime (Y1: 56%, Y2: 38%, Y3: 40%), and cost of housing (Y1: 35%, Y2: 35%, Y3: 36%). The third graph, querying if litter, air quality, and noise are major problems, shows the percentage answering 'Yes': litter (Y1: 72%, Y2: 75%, Y3: 65%), air quality (Y1: 66%, Y2: 62%, Y3: 60%), and noise (Y1: 58%, Y2: 55%, Y3: 53%).
Given the complexity of the image, the above description may not be entirely accurate.
Skyrocket your IELTS band score by 1-2 points in under a month with our premium plan!
Note: Both the topic and the answer were created by one of our users.
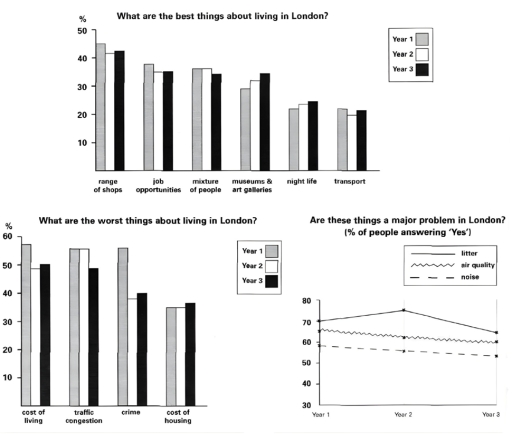
The bar charts demonstrates the outcomes of a survey that held over a three year peiod to determine the best things and worst things about living in London while the line graph illustrates the major things that causes problem over the period.
It is clear that the best things about living in London are job opportunities, range of shops, trasportation system, museums and art galleries while the worst things are cost of living, traffic congestion, crime etc. Besides, litter, air quality and noise creates major problem in London.
In terms of best things we can see that the percentages were high in the first year. In the following two years the rate gradually slowed down although museum and art galleries, night life and transportation system rose suddenly. On the contrary, the rate of worst things were highest in the first year. The rate continously decreased in the following years.
From the line graph we say that 70% people believe litter is the main problem in London whereas 65% and 60% inviduals believe air quality and noise are the major problem respectively. we can see the percentage of litter increased gradualy in the next year. However, the rate again began to decrease and came down to over 60%. Besides, the rate of other two things decreased gradually.
Word Count: 216