Our system will evaluate the answer based on this AI-generated description.
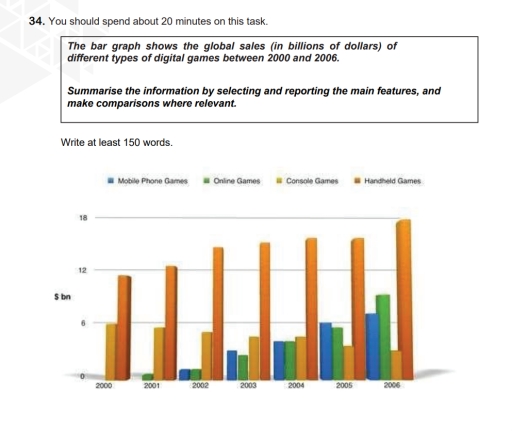
The image features a bar graph displaying global sales in billions of dollars ($ bn) across four categories—Mobile Phone Games, Online Games, Console Games, and Handheld Games—from 2000 to 2006. The vertical axis is labeled $ bn with markings at 0, 6, 12, and 18, while the horizontal axis lists the years 2000 to 2006. In 2000, sales are 0 for Mobile Phone Games, 0 for Online Games, 6 for Console Games, and approximately 11.5 for Handheld Games. In 2001, values are 0 for Mobile Phone Games, approximately 0.5 for Online Games, 5.5 for Console Games, and 12.5 for Handheld Games. In 2002, sales are approximately 0.8 for Mobile Phone Games, 0.8 for Online Games, 5 for Console Games, and 14.5 for Handheld Games. In 2003, values stand at approximately 3 for Mobile Phone Games, 2.5 for Online Games, 4.5 for Console Games, and 15 for Handheld Games. In 2004, sales are approximately 4 for Mobile Phone Games, 4 for Online Games, 4.5 for Console Games, and 15.5 for Handheld Games. In 2005, figures are 6 for Mobile Phone Games, 5.5 for Online Games, 3.5 for Console Games, and 15.5 for Handheld Games. In 2006, sales reach approximately 7 for Mobile Phone Games, 9 for Online Games, 3 for Console Games, and nearly 18 for Handheld Games.
Given the complexity of the image, the above description may not be entirely accurate.
Skyrocket your IELTS band score by 1-2 points in under a month with our premium plan!
Note: Both the topic and the answer were created by one of our users.
The bar chart illustrates the global sales of four types of digital games,namely phone games,online games,Console games,Handfield games from 2000 to 2006.The figure are measured in billions of dollars.
Overall, sales of digital handfield games was the highest throughout the period and increased considerably.In contrast, console games experienced steady decline.while,Mobile phone games and online games were started with no sales ,but showed significant increased.
In 2000,Handfield games generated $11billions,compared from console games at $6 billions.Handfield games rose steadly approixmately $15,$16,$17 billions in 2002, 2004 and 2005 respectively.while in 2006, handfield games climbed steeply $18 billions.
In contrast,Console game followed opposit trend.It fell from $6 billions in 2000, almost about $5 billions in 2001 and $4 billions in 2004.It decline slightly to $3 billions in 2006.
While,Mobile phone games and online games become increased in sales,online games started at zero in 2000, and grew steadly $7 billions in 2006.Whereas, mobile phone games started at $1 billions in 2002,and increased upto $6 billions in the final year.
Word Count: 165
