🔥 Today Only: Save 30% on Premium — Offer Ends Soon! - Upgrade Now!
Bar Chart

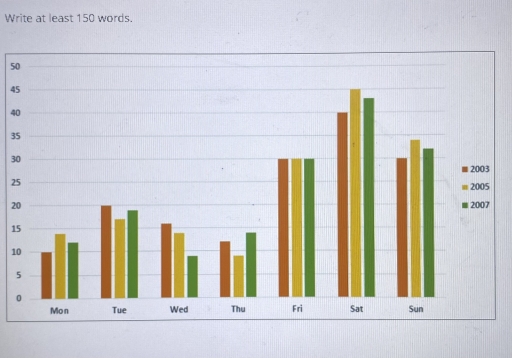
Band 8+: The bar shows the percentage of people going to cinemas in one European country on different days.

Image for topic: The bar shows the percentage of people going to cinemas in one European country on different days.
Our system will evaluate the answer based on this AI-generated description.
The image displays a bar chart with vertical bars representing three different years identified by labels: 2003, 2005, and 2007, organized by days of the week from Monday to Sunday along the horizontal axis. The Y-axis measures numerical values from 0 to 50 in increments of 5. Here are the approximate data for each day and year: Monday: 2003 (~10 units), 2005 (~17 units), 2007 (~12 units); Tuesday: 2003 (~12 units), 2005 (~21 units), 2007 (~14 units); Wednesday: 2003 (~15 units), 2005 (~28 units), 2007 (~22 units); Thursday: 2003 (~18 units), 2005 (~32 units), 2007 (~30 units); Friday: 2003 (~48 units), 2005 (~45 units), 2007 (~44 units); Saturday: 2003 (~43 units), 2005 (~40 units), 2007 (~45 units); Sunday: 2003 (~42 units), 2005 (~37 units), 2007 (~40 units). The bars are grouped closely together in sets of three (one bar for each year) under the label of each day, providing a clear visual comparison across the days of the week for each year included in the dataset.
Given the complexity of the image, the above description may not be entirely accurate.
Note: Both the topic and the answer were created by one of our users.

⸻

The graph illustrates the percentage of people going to the cinema in one European country on seven different days, showing changes in cinema attendance from 2003 to 2007.

Overall, it is noticeable that the percentage of people attending the cinema varies depending on the day of the week, with Friday and Saturday showing the highest peaks. There are also some differences in attendance between 2003, 2005, and 2007, with 2007 showing the highest figures compared to the other years.

We can see that cinema attendance increased significantly towards the weekend, with Saturday being the peak in all three years. On Monday, the percentage was the lowest, at around 10%. After that, the figures rose steadily until reaching a peak on Saturday. In 2005, Saturday attendance was just under half, while in 2003 and 2005 it was approximately 40-42%.

While weekday attendance from Monday to Friday remained relatively stable across all three years, Saturday figures showed some variation. In 2003 and 2005, Saturday attendance was about 30%, but in 2007 it reached the highest point at 40%. Following this, Sunday showed little change: in 2003 the figure was exactly 30%, while in 2005 and 2007 it was slightly higher at around 33%, showing a difference of about 3%.

Word Count: 208

Answers On The Same Topic:

The bar shows the percentage of people going to cinemas in one European country on different days.

The graph illustrates the percentage of people going to cinema in one European country on 7 different days showing the changes in cinema attendance from 2003 to 2007. Overall, it is noticiable that the percentage of people attending cinemas varies depending on the days of the week, Friday and Saturday showed the highest peak.There are […]

The bar shows the percentage of people going to cinemas in one European country on different days.

The bar chart illustrates the porprotion of indidual going to cinemas in selected one European country on different days. Overall, it can be concluded from the given information that the figure of saturday experienced and upward trend in European people went to cinemas, while a downward trend was seen in monday and thursday over the […]

The bar shows the percentage of people going to cinemas in one European country on different days.

The provided bar graph illustrates the proportion of people going to cinemas from Monday to Sunday in 2003, 2005, and 2007 in a European country. Overall, Saturdays attracted the highest cinema attendance throughout the years, while Mondays and Thursdays saw the lowest participation rates. Additionally, Fridays maintained a steady attendance across the years. Focusing on […]

The bar shows the percentage of people going to cinemas in one European country on different days.

The given bar graph illustrates the proportion of people going to cinemas from Monday to Sunday in 2003, 2005, and 2007 in a European country. Overall, Saturdays saw the most people going to cinemas in all three years, while Mondays, Wednesdays, and Thursdays experienced the lowest rate among all groups. Additionally, the percentage of Fridays […]

See All

Other Topics:

The graph shows changes in meat production worldwide between 2010 and 2020.Summarise the information by selecting and reporting the main features, and make comparisons where relevant.

The diagram illustrates differences in meat production worldwide between 2010 and 2020. Overall, in this chart the most popular meat type is pork and beef, while sheep meat is least popular. Beef increased and dominated constantly 8 years, while poultry increased significantly only in 2020. In 2010, Beef had the highest production, maintaining 25 million […]

The chart below shows the destinations of students graduating from Physics and from Arts Design in one European country in 2007. Summarize the information by selecting and reporting the main features, and make comparisons where relevant. Write at least 150 words.

The chart illustrates the destinations of scholars advancing from Physics and from Arts and Design in one European country in a given year (2007). Overall, the majority of the pupils after graduating with Arts and Design are likely to get employed immediately, while in the case of Physics, many students are rather also focusing on […]

The chart below shows the main reasons why agricultural land becomes less productive in three regions of the world. Summarise the information by selecting and reporting the main features, and make comparisons where relevant.

The chart illustrates the information about the important causes of low production of agriculture. The data comapare figures about 3 continents which is North America, Europe and Oceania. Overall, the higest reason for degradation of land crop is over grazing, followed by deforestation and over cultivation. However, the uncommon reasons are unknowns. In detail, the […]

The chart below shows the destinations of students graduating from Physics and from Arts Design in one European country in 2007. Summarize the information by selecting and reporting the main features, and make comparisons where relevant. Write at least 150 words.

The chart illustrates the destinations of scholars advancing from Physics and from Arts Design in one European country in given year(2007). Overall, majority of the pupils after graduating with Arts and Design are likely to get employed immediately, while in the case of Physics many students are rather also focusing on further study and training […]

The bar chart below shows figures of annual coffee and meat consumption.

The bar chart depicts the consumption of coffee and meat anually in 7 developed countries. It can be clearly seen from the chart that meat consumption is the highest among 7 countries, while coffee is the lowest. USA occupies the top rank of meat consumption by 122 kilograms per person. Furthermore, the consumption of meat […]

The graph shows the percentage of males aged 16-25 in a particular country who prefer watching sports to males who prefer participating in sports. Summarise the information by selecting and reporting the main features and make comparisons where relevant.

The diagram depicts the preferences of males aged 16-25 concerning viewing versus participating in various sports. It is evident that the proportion of males preferring watching is larger than that of spectators, whereas fishing stands out as a notable exception with the participation rate far surpassing the viewership. Another notable pattern is that football as […]

See All
We have detected unusual activity on your device.
Please verify your identity to continue.
Note: This verification step won't sign you in. If you have a premium account, please log in to access the service as usual.
Google/Gmail Verification
Or verify using Email/Code
We've sent a verification code to:
youremail@gmail.com (Not your email?)
Enter it below to complete the verification process.
Ensure your email address is correct, your inbox is not full, and you check your spam folder. If no email arrives, consider using an alternative email.
You will need a Premium plan to perform your action!
Note: If you already have a premium account, please log in to access our services as usual.

Plans & Pricing

Our mission is to make quality education accessible for everyone.
However, to keep our hardworking team running and this service alive, we genuinely need your support!
By opting for a premium plan, not only do you sustain us in achieving the mission, but you also unlock advanced features to enrich your learning experience.

Free

For learners who aren't pressed for time

What's included on Free
100+ Cambridge IELTS Tests
Instant IELTS Writing Task 1 & 2 Evaluation (2 times/month)
Instant IELTS Speaking Part 1, 2, & 3 Evaluation (2 times/month)
Instant IELTS Writing Task 1 & 2 Essay Generator (2 times/month)
500+ Dictation & Shadowing Exercises
100+ Pronunciation Exercises
Flashcards
Other Advanced Tools

Premium

For those serious about advancing their English proficiency, and for IELTS candidates aspiring to boost their band score by 1-2 points (especially in writing & speaking) in just 30 days or less

What's included on Premium
Save Your IELTS Test Progress & Analyze Mistakes By Question Type
Save Your Own Flashcard Sets & Use Them On Any Device
Unlock All Courses, IELTS Tests, Section & Part Practice
Unlimited AI Conversations
Unlimited AI Writing Enhancement Exercises
Unlimited IELTS Writing Task 1 & 2 Evaluation
Unlimited IELTS Speaking Part 1, 2, & 3 Evaluation
Checked Answers Will Not Be Published
Unlimited IELTS Writing Task 1 & 2 Essay Generator
Unlimited IELTS Speaking Part 1, 2, & 3 Sample Generator
Unlimited Usage Of Advanced Tools & AI Features
Priority Support within 24h (12-month plan only)

Due to the nature of our service and the provided free trials, payments are non-refundable.